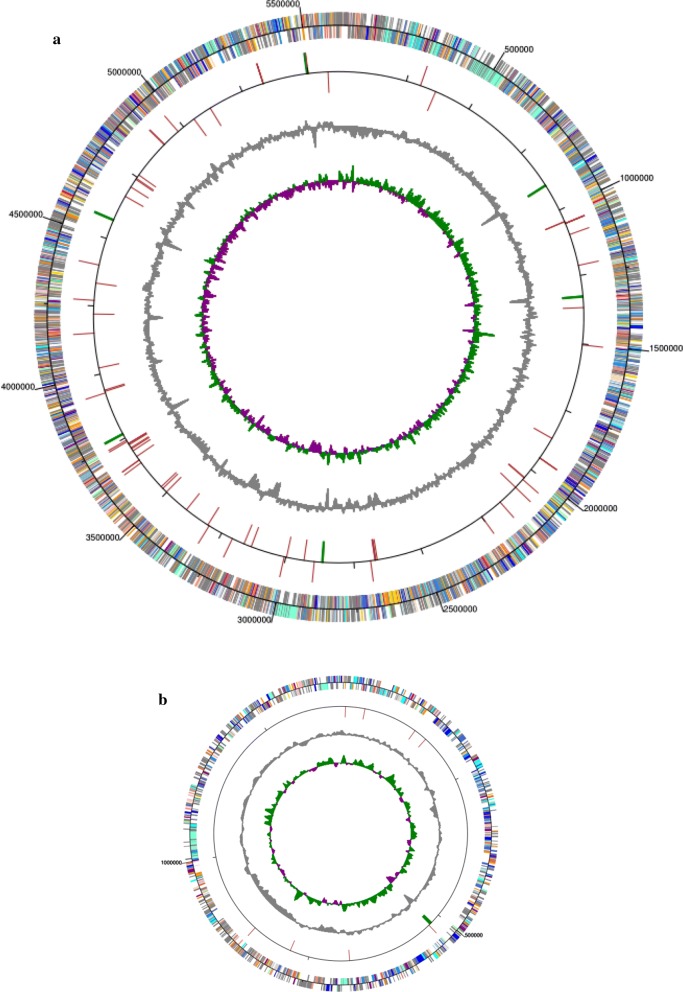
Fig. 1.
Circular map of the Streptomyces diastaticus CS1801 genome. a Chromosome; b plasmid. From the outside to the inside: the first circle represents the COG database-annotated genes, with the color corresponding to the COG-annotated letter; the second circle represents RNA; the third circle is the GC content (the peak level reflects the GC amount), with the outer circle representing the sense chain and the inner circle representing the antisense chain; and the innermost circle reflects the asymmetry of the GC content

