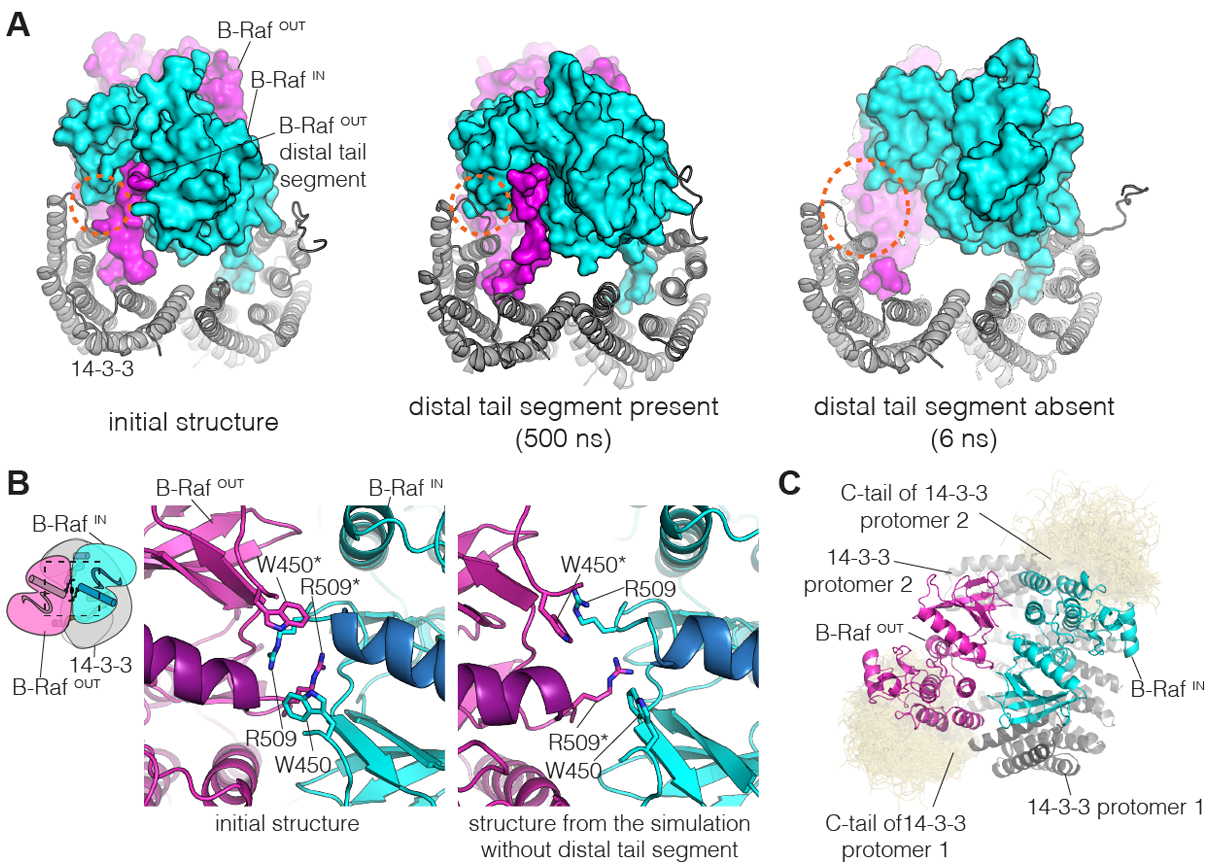
Figure 4. Molecular dynamics simulations of the B-Raf:14-3-3 complex.

(A) Instantaneous structures from two representative simulations are shown. Left, initial structure. Middle, structure after 500 ns, for one of the simulations with the distal tail segment intact. Right, structure after 6 ns, for one of the simulations with the distal tail segment deleted. Orange dashed circles indicate a region of close contact between B-RafIN and 14-3-3 in the initial structure. (B) Disruption of the B-Raf dimer interface in one of the simulations in which the distal tail segment of B-RafOUT was deleted. The interface between the kinases is shown for the initial structure (left) and the structure after 500 ns of simulation (right). (C) Interactions between the C-terminal tails of 14-3-3 and the B-Raf kinase domains. Shown here is a superposition of the backbone structures of the 14-3-3 tails (yellow) for three simulations with the distal tail segment of B-RafOUT intact, sampled every nanosecond over 500 ns. The 14-3-3 tails cluster around the C-lobes of the two B-Raf kinase domains. This occurs due to electrostatic complementarity, with each instantaneous structure forming two to three ion pairs between each tail segment and the adjacent kinase domain (Fig. S15).
