Abstract
Purpose:
Cone-beam computed tomography (CBCT)-guided small animal radiation research platform (SARRP) has provided unique opportunities to test radiobiological hypotheses. However, CBCT is less adept to localize soft tissue targets growing in a low imaging contrast environment. Three-dimensional bioluminescence tomography (BLT) provides strong image contrast and thus offers an attractive solution. We introduced a novel and efficient BLT-guided conformal radiation therapy and demonstrated it in an orthotopic glioblastoma (GBM) model.
Methods:
A multispectral BLT system was integrated with SARRP for radiation therapy (RT) guidance. GBM growth curve was first established by contrast-CBCT/MRI to derive equivalent sphere as approximated gross target volume (aGTV). For BLT, mice were subject to multispectral bioluminescence imaging, followed by SARRP CBCT imaging and optical reconstruction. The CBCT image was acquired to generate anatomical mesh for the reconstruction and RT planning. To ensure high accuracy of the BLT-reconstructed center of mass (CoM) for target localization, we optimized the optical absorption coefficients μa by minimizing the distance between the CoMs of BLT reconstruction and contrast-CBCT/MRI-delineated GBM volume. The aGTV combined with the uncertainties of BLT CoM localization and target volume determination was used to generate estimated target volume (ETV). For conformal irradiation procedure, the GBM was first localized by the pre-determined ETV centered at BLT-reconstructed CoM, followed by SARRP radiation. The irradiation accuracy was qualitatively confirmed by pathological staining.
Results:
Deviation between CoMs of BLT reconstruction and contrast-CBCT/MRI-imaged GBM is approximately 1.0 mm. Our derived ETV centered at BLT-reconstructed CoM covers > 95% of the tumor volume. Using the 2nd-week GBM as an example, the ETV-based BLT-guided irradiation can cover 95.4 ± 4.7% tumor volume at prescribed dose. The pathological staining demonstrated the BLT-guided irradiated area overlapped well with the GBM location.
Conclusion:
The BLT-guided RT enables 3D conformal radiation for important orthotopic tumor models, which provides investigators a new pre-clinical research capability.
1. Introduction
A major challenge facing investigators is to correctly deliver radiation to animal models, so that their pre-clinical investigations are closely aligned with clinical practice. Our group developed the small animal radiation research platform (SARRP) to resemble a clinical radiation machine (1,2). While CBCT provides the valuable irradiation guidance (3–6), it is unable to localize soft tissue targets growing in a low image contrast environment.
Because of strong soft tissue contrast and non-ionizing features, bioluminescence imaging (BLI) offers an attractive solution to localize soft tissue target. Although BLI has been extensively applied in pre-clinical oncology studies (7–9), the 2D image on an animal surface is inadequate to guide radiation delivery. Because optical transport from an internal light source is highly susceptible to the irregular torso and tissue optical properties, BLI of the surface emission cannot be used reliably to infer the internal source location for radiation guidance (10,11). This recognition led us to integrate 3D bioluminescence tomography (BLT) with SARRP for target localization (10,12). In BLT, a forward model of light propagation through tissue to the skin surface is employed, in conjunction with an optimization algorithm, to reconstruct the underlying 3D source distribution, which minimizes the difference between calculated and measured surface BL signal.
The significance of this work is that a novel and efficient BLT-guided conformal RT is proposed to overcome the challenging of soft tissue targeting based on the CBCT guidance. To demonstrate and validate the BLT-guided irradiation, we chose an orthotopic glioblastoma (GBM) model growing in a low CBCT imaging contrast environment for this study. There are two innovative aspects. 1) The GBM model (GL261-Luc2) has been widely used in research (13–16). This orthotopic model is deep-seated in the brain and non-detectable using X-ray only. From the best of our knowledge, it is the first study to demonstrate the BLT-guided irradiation using an orthotopic brain model, where researchers face great challenging to perform accurate irradiation with CBCT-guided system. 2) Our method uses the BLT-reconstructed center of mass (CoM) of the tumor and a pre-determined target volume to localize the tumor and guide irradiation. Because the target volume is pre-determined, the BLT system is mainly used to reconstruct the 3D CoM position to inform the target volume placement for radiation. Compared to commonly used multi-projection approach (17,18), only single projection BLT is required to resolve the GBM CoM location, which largely reduces the imaging acquisition time and increases experimental throughput. This approach is particularly useful for research investigation involving early stage tumor when weak BL signal and long imaging acquisition time are the major obstacles reducing experimental throughput.
In this work, we will demonstrate the in vivo BLT-CoM guided GBM irradiation, and discuss the optical guided irradiation for the pre-clinical study.
2. Methods and Materials
2.1. Mobile BLT-SARRP system
The detail of the systems is described in supplementary material Sec. 1. Briefly, our SARRP employs a dual focal X-ray source for irradiation (220kVp) and CBCT imaging (65kVp) (1,2). To achieve non-coplanar irradiation, it is equipped with a 360° isocentric gantry and a 4D (x, y, z translation and 360° rotation) couch. The moblie BLT system is equipped with a 3-mirror design directing BL light emitted from mouse to a stationary camera, CCD (Figure S1b in the supplementary material). Optical filters are used for multispectral image acquisition to improve BLT targeting accuracy (19,20). Because the SARRP CBCT is used to generate tetrahedral mesh of imaged animal for BLT reconstruction and define the coordinate for radiation, the 2D BLIs were mapped onto the animal surface of the CBCT image and used as the input data for the optical reconstruction. Studied animal is first imaged in the optical system to obtain surface BLIs, and then transferred to SARRP for CBCT imaging and BLT reconstruction, followed by BLT-guided irradiation.
2.2. Tumor growth curve
The purposes of establishing the GBM growth curve are two folds; 1) for conformal irradiation, target volume is needed to determine radiation field size. We established the growth curve using contrast-CBCT/MRI images and converted the measured tumor volume to equivalent sphere, as approximated gross target volume (aGTV) for radiation guidance. 2) For a given tumor stage/age, to optimize the mouse brain optical properties used in BLT reconstruction for superior localization accuracy, the CoMs of the contrast-CBCT/MRI-delineated GBM were taken as the ground truth for the optimization process (see Sec. 2.4). The GBM volume in C57BL/6J mouse left striatum was monitored with contrast CBCT imaging conducted in our in-house high-resolution CBCT system (21). For early age tumor, such as 1 week after GBM initiation, we faced challenging to detect the GBM using the contrast CBCT, likely due to poor vascularization of the malignancy. A small animal MRI (17.6T, 750MHz MRI/NMR; Bruker Corp., Billerica, MA) in T2-weighted mode was used to delineate the early age GBM. Because SARRP CBCT imaging determines the BLT coordinate, the contrast CBCT and MRI images were registered to the SARRP CBCT images. The MRI is less utilized for our study because MRI facility is not in proximity to the SARRP, and thus extra caution of animal transport is needed. The GBM volume and its CoM of the registered contrast-CBCT/MRI image were determined through image segmentation (supplementary material Sec. 2).
It is worthwhile to mention that although contrast CBCT was used to delineate the GBM volume for validation purpose, it is not an ideal imaging modality to guide irradiation. Although contrast CBCT shows better image contrast compared to regular CBCT, it is still suffered from low image contrast issue, which is further confounded by fast clearance and tumor vascularization. For poorly vascularized tumor or tumor at early stage as described previously, there could be low or none contrast uptake. As we described in the supplementary material Sec. 2, it is not a trivial task to segment the tumor volume which involves large amount of post-processing time and image registration between the in-house high resolution CBCT (21) and SARRP CBCT systems. In terms of experiment throughput, such prolong process can be a major concern to utilize contrast CBCT for irradiation guidance.
2.3. in vivo BLT-CoM reconstruction
Before BL imaging session, mouse hair was shaved, followed by depilation. D-luciferin (200 L, 10 mg/mL, PerkinElmer, Waltham, MA) was administrated via IP injection. Mouse was placed at prone position, and 10 min after the luciferin injection, four BLIs at 590, 610, 630, and 650 nm (8 × 8 binning, 0.96 mm/pixel) were acquired. Since the field of view of our BLIs at dorsal-to-ventral (DV) direction covers most signal emitted from GBM, single DV projection was chosen for our study. The BLIs were corrected by the normalized spectral weights (1, 0.85, 0.59, and 0.34 for 590, 610, 630, and 650 nm, respectively) for the GL261-Luc2 cells. The published method using unfiltered image in between the spectral images to correct the temporal BL signal variation in vivo was also applied to the BLIs (10). Furthermore, the BLIs were calibrated for the intensity non-uniformity arising from the lens vignetting effect and non-uniform pixel response of the CCD chip. The reconstruction algorithm was previously published in Ref. (11). Briefly, the light propagation in tissue is described by the diffusion approximation;
| (1) |
where Φ(r) is the photon fluence rate at location r, is the diffusion coefficient, μa and are absorption and reduced scattering coefficients, respectively, and S(r) is the bioluminescence source distribution. The truncated conjugate gradient (IVTCG) algorithm (22) with adaptive shrinking strategy (23) was chosen to retrieve CoM of S(r).
2.4. Optimization of mouse brain μa
At our wavelength of interest, μa changes greatly, which can affect the BLT reconstruction accuracy. We determined the optimal μa values for our GBM-bearing animal cohort at the 1st–4th weeks after tumor initiation by an optimization routine; we minimized the spatial deviation between the BLT reconstructed CoM and the CoM from contrast-CBCT/MRI-delineated GBM. Published values of normal brain μa (24–29) were used to determine the initial searching range for the μa. Several sets of μa as function of blood and water volume fraction ranging from 590–650 nm were entered into our BLT reconstruction engine (see supplementary material Sec. 3) and the resulted CoMs were compared to the CoMs of the contrast-CBCT/MRI GBM volume. To reduce the influence of the numerical mesh on the BLT reconstruction, for a given animal, we also generated three meshes. The sets with the CoM deviation < 1 mm among the three meshes were selected and averaged as the optimal set of μa for a given animal. The same approach was applied to five GBM-bearing mice at the same tumor age. The averaged μa of the five studied animals was taken as the final set for GBM-bearing mice for a given tumor age. The μs’ at 590–650 nm exhibit relative constant behavior, and thus we used literature values 1.62, 1.56, 1.51, and 1.46 mm−1 (29) for our study, respectively. The refractive index of mouse brain was set as 1.4 (30).
2.5. Pre-determined target volume
To sufficiently irradiate the target, we designed the estimated target volume (ETV), which composites aGTV and radiation margin including the uncertainties of BLT-CoM target localization and the deviation of aGTV determination through the image method (Sec. 2.2). The margin M is symmetrical and is added onto the aGTV to form the ETV by
| (2) |
where RETV and RaGTV are the radius of ETV and aGTV spherical volume, respectively. The margin can be further expressed as
| (3) |
where for a given tumor age, ΣCoM is the averaged deviation between BLT reconstructed CoM and that of the contrast-CBCT/MRI-delineated GBM volume, and σaGTV and σCoM are the corresponding standard deviation (STD) of the aGTV radius and the CoMs deviation.
2.6. Power analysis
One sample t-test (sampsizepwr function, MATLAB R2018a, MathWorks, Natick, MA) was chosen to perform the power calculation. The calculation was applied to the data for tumor growth and aGTV radius (Figure 1), optimized μa for a given wavelength, CoM deviation (Figure 3), and ETV coverage (Figure 4c) versus the age of GBM.
Figure 1.
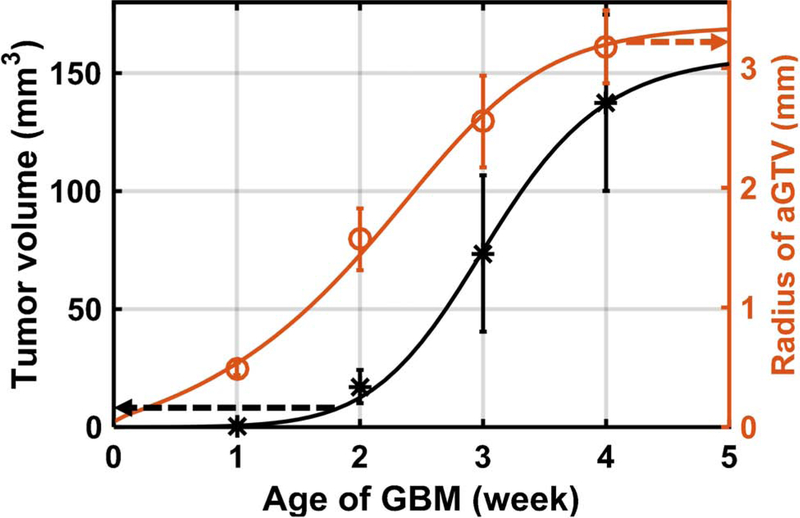
The contrast-CBCT (2nd–4th weeks) and MRI (1st week)-delineated GBM volume (black dots); the radius of aGTV (red circles) is converted from the corresponding GBM volume. The GBM volume and aGTV radius can be described by the sigmoid fitting (black and red curve).
Figure 3.
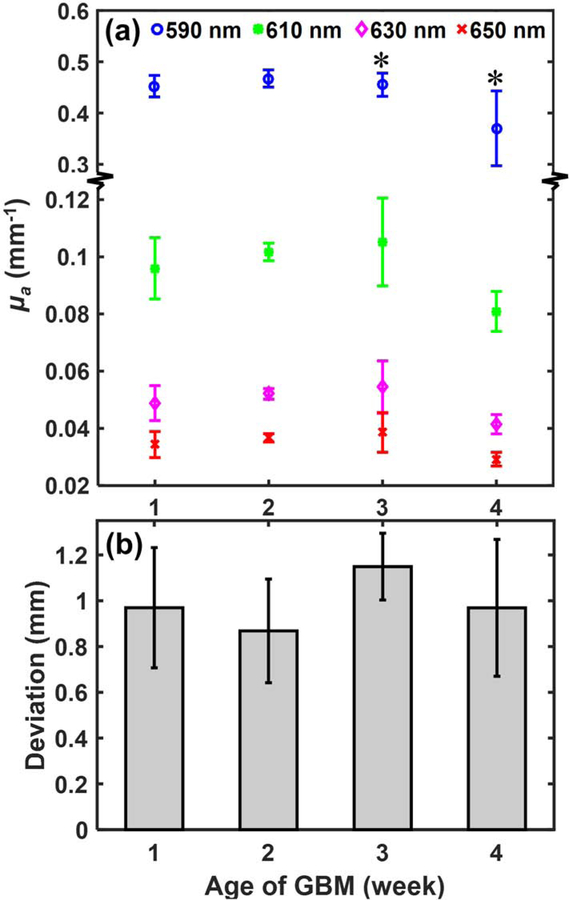
(a) The μa of mouse GBM brain at 1st–4th weeks after cell injection; the ‘*’ symbol indicates significant difference of the μa (P < 0.05) between the 3rd and 4th week GBM at each wavelength. (b) shows the deviations between the CoMs of BLT reconstruction and contrast-CBCT/MRI-delineated GBM.
Figure 4.
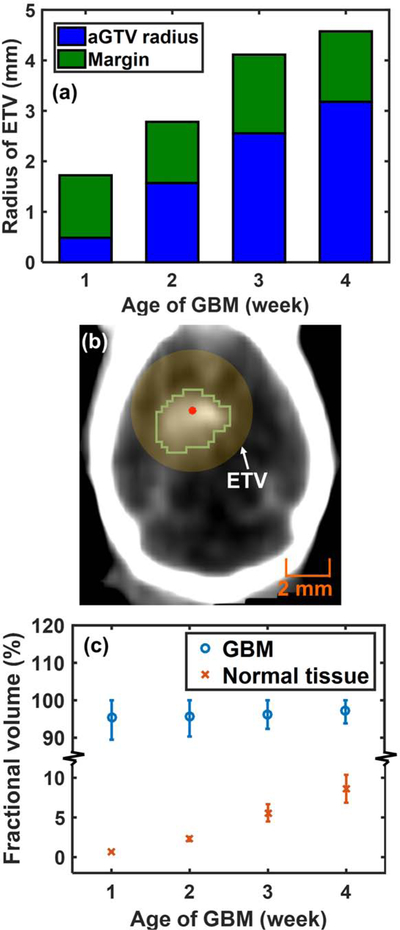
(a) RETV at 1st–4th weeks after cell injection; (b) an example of the ETV (yellow region) centered at BLT-reconstructed CoM (red dot) covering the contrast-delineated 2nd-week GBM (green contour). (c) The average fraction with STD of the contrast-CBCT/MRI-delineated GBM and normal tissue volume covered by the ETV. The upper STD is capped at 100% for ETV-tumor coverage.
3. Results
A sigmoid fitting is used to describe the GBM growth data (n = 5 /data point, R2 > 0.99, Figure 1):
| (4) |
where V is tumor volume in mm3, t is age/week of GBM, and a=3.9×10⁻⁴, b=2.5×10⁻⁶, c=7.4 are fitting parameters. The curve illustrates the GBM grow slowly at early age and increase at late stage. The corresponding radius of aGTVs and the fitting curve (R2 > 0.99) were derived from the GBM growth data.
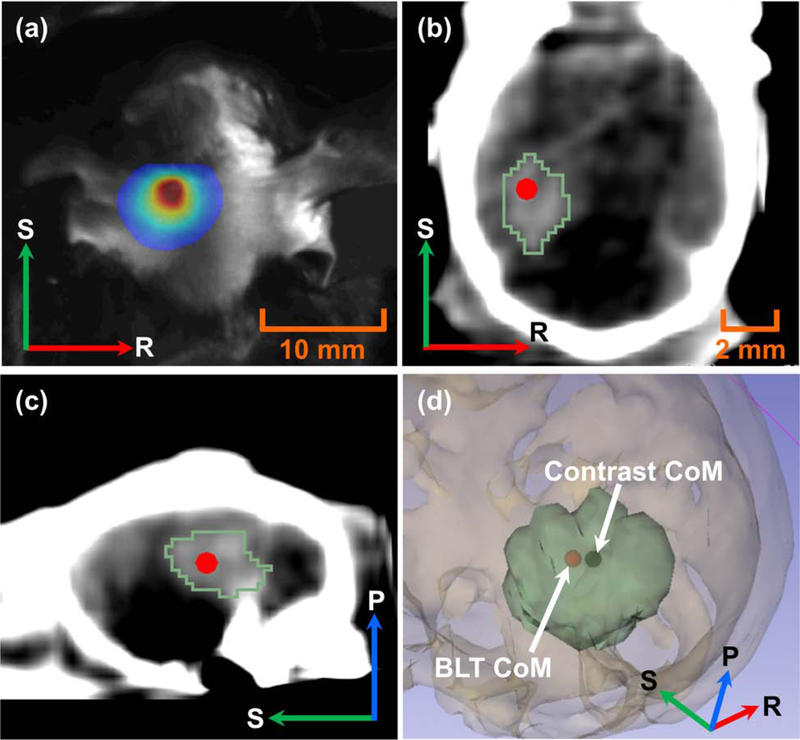
Figure 2 shows a representative result of BLT reconstructed CoM of in vivo GBM. Figure 2b–c show the reconstructed CoM overlapped with the contrast-delineated GBM. The 3D rendering (Figure 2d) shows 0.5 mm accuracy between the BLT reconstructed CoM and the CoM of the contrast-labeled volume, taken as ground truth.
Figure 2.
(a) 2D surface BLI of the 2nd-week GBM at 630 nm; contrast-delineated GBM (green contour) and BLT-reconstructed CoM (red dot) in (b) coronal and (c) sagittal views; (d) 3D rendering shows CoM (black dot) of contrast-labeled GBM volume (green volume) vs. BLT-reconstructed CoM (red dot).
The optimized μa at the 1st–4th weeks (n = 5 /week) for the wavelength of interest is shown in Figure 3a. We noted the significant decrease of μa from the 3rd to 4th week for all the wavelength cases. This phenomenon could be attributed to the growing necrosis occurred during the late stage GBM (see Figure S2c), which might reduce blood volume, and thus introduce the decrease of light absorption, μa. The optimized μa at each time point was then used for BLT CoM reconstruction. Figure 3b shows no significant difference of the reconstructed CoM for all the tumor ages considered (n = 5 /week). It renders that the accuracy of the reconstructed CoMs is independent from tumor volume. The deviation between the optical reconstructed CoMs and the CoMs from contrast-CBCT/MRI-delineated GBM is approximately 1 mm for all the cases.
Figure 4a shows the radius of ETV composed of aGTV radius and radiation margin. As the result of Figure 3 implied, the increase of ETV largely depends on the tumor size but not the BLT localization accuracy. Figure 4b is an example showing that the ETV centered at BLT reconstructed CoM can cover the contrast-delineated 2nd-week GBM. The reason to choose the 2nd-week GBM as the representative case is due to the balance between the tumor and normal tissue volume. The 2nd-week GBM shows relatively moderate tumor volume, which is favorable for us to demonstrate the BLT-guided RT. Furthermore, the 1st–2nd week GBM are the common stage used for biological experiments (13,31). Figure 4c demonstrates the spherical ETV covering, in average (n = 5 /week), > 95% of the contrast-CBCT/MRI-delineated GBM for all the tumor stage considered. To evaluate the normal tissue toxicity introduced by the ETV-based conformal RT, as we expected, the normal tissue fraction (the fraction of normal tissue within ETV to the normal tissue of mouse head) increases along with the increase of ETV, up to 8.6 ± 1.8%.
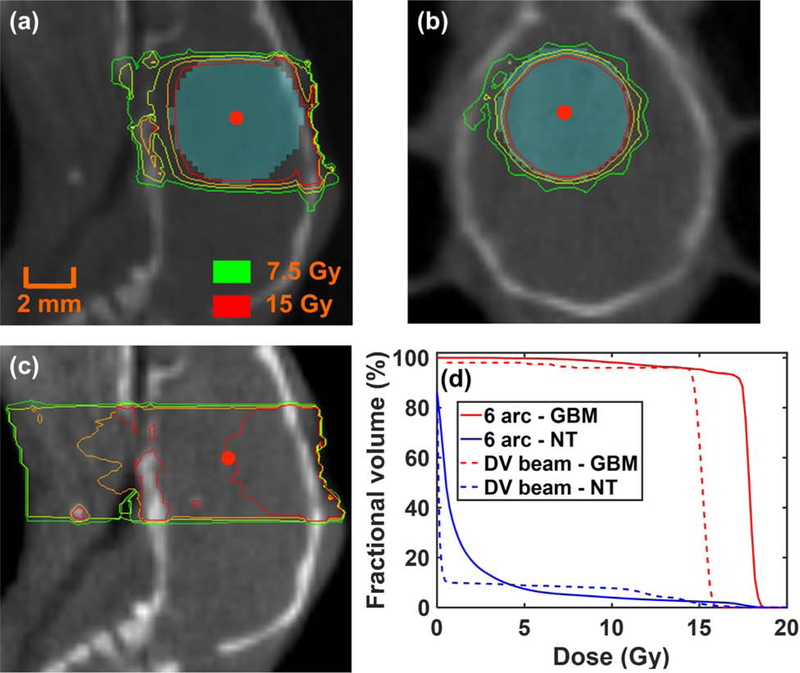
Figure 5a–b demonstrates an example of applying the BLT-guided non-coplanar 6-arc conformal delivery to the 2nd-week ETV with 5 × 5 mm2 square collimation. The arc beams generated a nearly spherical dose distribution. Single dose of 15 Gy was prescribed to cover the ETV (see supplementary material Sec. 4 and 5 for detail). Because the ETV is only function of tumor age and brain is relative X-ray homogenous compared to other organ, dose-volume histogram (DVH) of the ETV coverage is not expected to exhibit large variation for different animals (≤ 3.1%, Figure S5b) for a given GBM age. For comparison, the dosimetric plan of single DV beam, commonly used for radiobiology studies, was generated (Figure 5c). We followed the common practice; the single field was guided by the surgical opening at the skull surface, and the 15 Gy was prescribed to the cell implementation site 3 mm away from the opening (13) indicated by CBCT image. In comparison with the BLT-CoM guided irradiation, the undesired normal tissue irradiation and the inferior target coverage are shown in the single field case (Figure 5a, b vs c). The average DVH quantitatively shows superior tumor coverage for the BLT-CoM guided RT, contrast-labelled GBM used as reference (Figure 5d, n = 5). Figure S5c–d further shows average 95.4 ± 4.7% and 55.0 ± 33.1% GBM coverage at the 15 Gy for BLT-guided and DV irradiation, respectively. For normal tissue, larger fraction of mouse head was irradiated with high dose in the single beam scenario (Figure 5d).
Figure 5.
Dose distributions of 6-arc delivery to the 2nd-week ETV (cyan region) centered at BLT-reconstructed CoM (red dot) in (a) sagittal and (b) coronal views; (c) dose distribution of single DV beam irradiation; (d) averaged DVHs of 6-arc and DV irradiation for 2nd-week contrast-delineated GBM and normal tissue (NT), respectively.
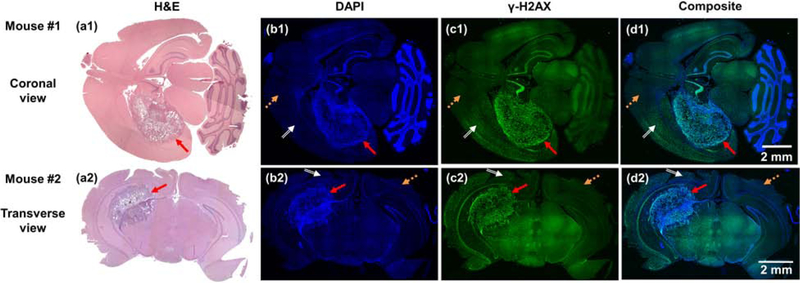
The 2nd-week GBM bearing mice (n = 4) were used as a representative case for on-site BLT-guided conformal irradiation. To demonstrate the radiation delivery, Figure 6 shows examples of brain tissue sections, stained by H&E, DAPI and γ-H2AX (see supplementary material Sec. 6 for detail). Due to the limitation of tissue staining, we used two mice to demonstrate the 3D feature of the conformal irradiation (Figure 6a1–d1, a2–d2). The H&E staining reveals the GBM location (Figure 6a1–2, red arrows). These results are confirmed by the DAPI images where the high dense DNA area inferring the GBM location was located (Figure 6b1–2). The high-dense DNA region/GBM location is overlapped well with the irradiated area stained by the γ-H2AX (Figure 6b1 and c1, and 6b2 and c2). The orange dash and white double line arrows point to normal tissue area (Figure 6b–d). Because of the conservative spherical ETV, as we expected, the irradiated area is larger than the GBM location, shown in the γ-H2AX and composited images (white double line arrows, Figure 6c1–d1 and c2–d2).
Figure 6.
(a1–c1 and a2–c2) are H&E, DAPI and γ-H2AX staining in coronal and transverse brain sections from two mice, respectively, and (d1 and d2) are the composited images of DAPI and γ-H2AX staining. Red solid, orange dash, and white double line arrows point to the GBM, normal tissue, and normal tissue irradiated area, respectively.
4. Discussions
The importance of the image-guided pre-clinical RT lies in the abilities of precisely locating and conformally irradiating targets, reducing normal tissue toxicity, and thus minimizing experimental uncertainties, which ultimately determines the reproducibility of research investigation. Furthermore, soft tissue target localization is particularly critical at the present time when important orthotopic tumor models have been heavily used for pre-clinical RT studies (32–35). Our group (10–12,21) and others (36,37) have actively investigated the BLT-guided RT.
The significance of this study is the development of the new in vivo BLT-CoM guided irradiation enabling conformal RT for orthotopic tumor model at low CBCT imaging contrast environment. The CoM-ETV-based method effectively covered the GBM, but the conventional single field irradiation inevitably under-covered the target and deposited larger fraction of high dose to normal tissue (Figure 5d and S5c–d). Moreover, the novelties of the proposed BLT-irradiation are the efficient acquisition of the BLT reconstructed CoM, and pre-determined optical properties, spherical target volume/ETV, and treatment plan. The growth curves for other tumor types have also been published (38–40), which can be used to establish the aGTV and facilitate the ETV-based conformal RT.
This study shows the depth information of GBM CoMs can be resolved at 1 mm accuracy with the single projection and multi-spectral BLT (Figure 3b). Multi-projection and multi-spectral BLT has been proposed to reconstruct target volume (17,18). The advantage of single projection BLT is clearly the shorter image acquisition time compared to the multiple-projection approach, which becomes more critical for the studies involving tumor model with weak in vivo signal. However, we do not exclude the potentiality to apply the multi-projection and -spectral BLT for target volume delineation, particularly for highly complicated disease such as pancreatic tumor where the target could be quite irregular in shape (41), and/or even in multi-focal forms (42). The accurate tumor volume reconstruction versus the CoM-ETV approach is a trade-off between the requirement of radiation delivery accuracy and experimental throughput. Nevertheless, a spectral derivative reconstruction algorithm has been recently proposed (43) for target volume reconstruction beyond CoM. This line of work is ongoing in our group.
The μa is known to have impact on the reconstruction accuracy (44), because it governs the probability of light being absorbed in tissue and the wavelength-dependent μa determines the accuracy of BLT reconstructed target depth. For the mouse GBM, the factors of increasing blood volume with angiogenesis, necrosis, and hypoxia likely affect the μa, which can also be function of tumor age. To determine the optimal μa for reconstruction, we innovatively treated μa as optimization parameter for our reconstruction process. It is worthwhile to mention that the μa was optimized under our IVTCG algorithm reconstruction frame, and another set of μa may be need if one uses different algorithm.
Since brain is less susceptible to anatomical variation, under well-controlled experimental conditions, i.e. maintaining consistent procedure of tumor implementation and animal size, the pre-determined ETV is an efficient approach to apply conformal irradiation along with optical reconstructed CoM. It is worthwhile to emphasize that the SARRP irradiation is accurate at 0.2 mm (2). It renders once the target volume is provided, such as ETV in our study, the SARRP can deliver the prescribed dose at the high accuracy. The systematic and comprehensive validation for our BLT-CoM guided RT lies in the result of Figure 4c. We have demonstrated that the ETV centered at BLT reconstructed CoM could cover average > 95% of the actual tumor throughout different ages. With a well-designed treatment plan covering ETV within 100% prescribed dose, one can cover > 95% of the tumor volume. From the power analysis, for all the studies considered (Sec. 2.6), we have reached 90% power within 2 standard deviation for the given sample size (n = 5 /week). We would expect as the sample size is increased, the range of standard deviation or the uncertainties of our data distribution will be reduced for the same power. However, we further examined additional 5 GBM-bearing mice at 2nd week age. The ETV-tumor coverage still remains > 95% coverage in average. It suggests the increase of sample size likely will not change our conclusions presented in this work. Figure 5a–b nicely illustrate the BLT-CoM conformal GBM irradiation, and the pathological staining (Figure 6) served as a representative case showing a qualitative demonstration for on-site BLT-CoM guided RT.
Although our results are encourging, the spherical ETV is an approximation of the tumor geometry. The volume of early age tumor, such as the 1st-week GBM, is small and near-spherical, which is ideal for the ETV-based BLT-guided RT. In contrast, as tumor grows into irregular geometry, the conservative choice of ETV is challenging to cover the tumor while not to include normal tissue (Figure 6d1–2). However, without any spatial information of the soft tissue target, one can easily underdose the target (Figure 5c and d). The BLT-CoM-gudied RT demonstrated here is one important step to enable conformal irradiation for soft-tissue target.
5. Conclusion
In summary, the target localization accuracy from the in vivo BLT-CoM guided RT is at 1mm and the derived ETV can cover more than 95% of the GBM volume. The workflow of the BLT-guided RT is detailed in the supplementary material Sec.5, and is readily for investiagtors adopting for their research investigation.
Supplementary Material
Acknowledgment:
The authors would like to thank the funding support from Xstrahl Inc and NIH-NCI (R37CA230341 and R01CA240811) for this work.
Footnotes
Publisher's Disclaimer: This is a PDF file of an unedited manuscript that has been accepted for publication. As a service to our customers we are providing this early version of the manuscript. The manuscript will undergo copyediting, typesetting, and review of the resulting proof before it is published in its final form. Please note that during the production process errors may be discovered which could affect the content, and all legal disclaimers that apply to the journal pertain.
Conflict of interest: JWW is supported by the sponsor research agreement from Xstrahl Inc, and grants from NCI, during the conduct of the study and retainer fee as advisor to Xstrahl Inc. KKHW is supported by the sponsor research agreement from Xstrahl Inc, RefleXion Medical and the funding from NIH-NCI (R21CA223403, R37CA230341, R01CA240811, and P30 CA006973). ZD is supported by the sponsor research agreement from Xstrahl Inc, and the funding from NIH-NCI (R21CA223403, and R01CA240811). XX is supported by the sponsor research agreement from Xstrahl Inc, and the funding from NIH-NCI (R37CA230341). II reports research support from NIH-NCI. ML reports research support from NIH-NCI, Arbor, BMS, Accuray, DNAtrix, Tocagen, Biohaven; consultancy from Tocagen, SQZ Technologies, VBI; patent on focused radiation and immunotherapy; non-research consultancy - Stryker.
References
- 1.Wong J, Armour E, Kazanzides P, et al. High-resolution, small animal radiation research platform with X-ray tomographic guidance capabilities. Int J Radiat Oncol Biol Phys 2008;71:1591–1599. [DOI] [PMC free article] [PubMed] [Google Scholar]
- 2.Matinfar M, Ford E, Iordachita I, et al. Image-guided small animal radiation research platform: Calibration of treatment beam alignment. Phys Med Biol 2009;54:891–905. [DOI] [PMC free article] [PubMed] [Google Scholar]
- 3.Herter-Sprie GS, Korideck H, Christensen CL, et al. Image-guided radiotherapy platform using single nodule conditional lung cancer mouse models. Nat. Commun 2014;5:5870. [DOI] [PMC free article] [PubMed] [Google Scholar]
- 4.Chandra A, Lin T, Tribble MB, et al. PTH1–34 alleviates radiotherapy-induced local bone loss by improving osteoblast and osteocyte survival. Bone 2014;67:33–40. [DOI] [PMC free article] [PubMed] [Google Scholar]
- 5.Seifert L, Werba G, Tiwari S, et al. Radiation therapy induces macrophages to suppress T-cell responses against pancreatic tumors in mice. Gastroenterology 2016;150:1659–1672. [DOI] [PMC free article] [PubMed] [Google Scholar]
- 6.Sievert W, Stangl S, Steiger K, et al. Improved overall survival of mice by reducing lung side effects after high-precision heart irradiation using a small animal radiation research platform. Int. J. Radiat. Oncol. Biol. Phys 2018;101:671–679. [DOI] [PubMed] [Google Scholar]
- 7.Thorne SH, Contag CH. Using in vivo bioluminescence imaging to shed light on cancer biology. Proc. IEEE 2005;93:750–762. [Google Scholar]
- 8.O’Neill K, Lyons SK, Gallagher WM, et al. Bioluminescent imaging: A critical tool in pre-clinical oncology research. J. Pathol 2010;220:317–327. [DOI] [PubMed] [Google Scholar]
- 9.Close DM, Xu TT, Sayler GS, et al. In vivo bioluminescent imaging (BLI): Noninvasive visualization and interrogation of biological processes in living animals. Sensors 2011;11:180–206. [DOI] [PMC free article] [PubMed] [Google Scholar]
- 10.Zhang B, Wang KK-H, Yu J, et al. Bioluminescence tomography-guided radiation therapy for preclinical research. Int J Radiat Oncol Biol Phys 2016;94:1144–1153. [DOI] [PMC free article] [PubMed] [Google Scholar]
- 11.Yu J, Zhang B, Iordachita I, et al. Systematic study of target localization for bioluminescence tomography guided radiation therapy. Med Phys 2016;43:2619–2629. [DOI] [PMC free article] [PubMed] [Google Scholar]
- 12.Zhang B, Wong JW, Iordachita II, et al. Evaluation of on- and off-line bioluminescence tomography system for focal irradiation guidance. Radiat Res 2016;186:592–601. [DOI] [PMC free article] [PubMed] [Google Scholar]
- 13.Zeng J, See AP, Phallen J, et al. Anti-PD-1 blockade and stereotactic radiation produce long-term survival in mice with intracranial gliomas. Int. J. Radiat. Oncol. Biol. Phys 2013;86:343–349. [DOI] [PMC free article] [PubMed] [Google Scholar]
- 14.Kim JE, Patel MA, Mangraviti A, et al. Combination therapy with anti-PD-1, anti-TIM-3, and focal radiation results in regression of murine gliomas. Clin. Cancer Res 2017;23:124–136. [DOI] [PMC free article] [PubMed] [Google Scholar]
- 15.Feldman LA, Fabre MS, Grasso C, et al. Perfluorocarbon emulsions radiosensitise brain tumors in carbogen breathing mice with orthotopic GL261 gliomas. PLoS One 2017;12:e0184250. [DOI] [PMC free article] [PubMed] [Google Scholar]
- 16.Stefani FR, Eberstal S, Vergani S, et al. Low-dose irradiated mesenchymal stromal cells break tumor defensive properties in vivo. Int. J. Cancer 2018;143:2200–2212. [DOI] [PMC free article] [PubMed] [Google Scholar]
- 17.Lewis MA, Richer E, Slavine NV, et al. A multi-camera system for bioluminescence tomography in preclinical oncology research. Diagnostics 2013; 3:325–343. [DOI] [PMC free article] [PubMed] [Google Scholar]
- 18.Klose AD, Paragas N. Automated quantification of bioluminescence images. Nat. Commun 2018;9:4262. [DOI] [PMC free article] [PubMed] [Google Scholar]
- 19.Kuo C, Coquoz O, Troy TL, et al. Three-dimensional reconstruction of in vivo bioluminescent sources based on multispectral imaging. J. Biomed. Opt 2007;12:024007. [DOI] [PubMed] [Google Scholar]
- 20.Dehghani H, Davis SC, Jiang SD, et al. Spectrally resolved bioluminescence optical tomography. Opt. Lett 2006;31:365–367. [DOI] [PubMed] [Google Scholar]
- 21.Yang Y, Wang KK-H, Eslami S, et al. Systematic calibration of an integrated X-ray and optical tomography system for preclinical radiation research. Med Phys 2015;42:1710–1720. [DOI] [PMC free article] [PubMed] [Google Scholar]
- 22.He XW, Liang JM, Wang XR, et al. Sparse reconstruction for quantitative bioluminescence tomography based on the incomplete variables truncated conjugate gradient method. Opt. Express 2010;18:24825–24841. [DOI] [PubMed] [Google Scholar]
- 23.Naser MA, Patterson MS. Bioluminescence tomography using eigenvectors expansion and iterative solution for the optimized permissible source region. Biomed. Opt. Express 2011;2:3179–3192. [DOI] [PMC free article] [PubMed] [Google Scholar]
- 24.Jacques SL. Optical properties of biological tissues: A review. Phys. Med. Biol 2013;58:R37–R61. [DOI] [PubMed] [Google Scholar]
- 25.Zhao J, Ding HS, Hou XL, et al. In vivo determination of the optical properties of infant brain using frequency-domain near-infrared spectroscopy. J. Biomed. Opt 2005;10:024028. [DOI] [PubMed] [Google Scholar]
- 26.Ijichi S, Kusaka T, Isobe K, et al. Developmental changes of optical properties in neonates determined by near-infrared time-resolved spectroscopy. Pediatr. Res 2005;58:568–573. [DOI] [PubMed] [Google Scholar]
- 27.Abookasis D, Lay CC, Mathews MS, et al. Imaging cortical absorption, scattering, and hemodynamic response during ischemic stroke using spatially modulated near-infrared illumination. J. Biomed. Opt 2009;14:024033. [DOI] [PMC free article] [PubMed] [Google Scholar]
- 28.O’Sullivan TD, Cerussi AE, Cuccia DJ, et al. Diffuse optical imaging using spatially and temporally modulated light. J. Biomed. Opt 2012;17:071311. [DOI] [PMC free article] [PubMed] [Google Scholar]
- 29.Lin AJ, Koike MA, Green KN, et al. Spatial frequency domain imaging of intrinsic optical property contrast in a mouse model of Alzheimer’s disease. Ann. Biomed. Eng 2011;39:1349–1357. [DOI] [PMC free article] [PubMed] [Google Scholar]
- 30.Virostko J, Powers AC, Jansen ED. Validation of luminescent source reconstruction using single-view spectrally resolved bioluminescence images. Appl. Optics 2007;46:2540–2547. [DOI] [PubMed] [Google Scholar]
- 31.Martirosyan NL, Cavalcanti DD, Eschbacher JM, et al. Use of in vivo near-infrared laser confocal endomicroscopy with indocyanine green to detect the boundary of infiltrative tumor, Laboratory investigation. J. Neurosurg 2011;115:1131–1138. [DOI] [PubMed] [Google Scholar]
- 32.Tuttle SW, Hertan L, Daurio NA, et al. The chemopreventive and clinically used agent curcumin sensitizes HPV– but not HPV+ HNSCC to ionizing radiation, in vitro and in a mouse orthotopic model. Cancer Biol. Ther 2012;13:575–584. [DOI] [PMC free article] [PubMed] [Google Scholar]
- 33.Patel MA, Kim JE, Theodros D, et al. Agonist anti-GITR monoclonal antibody and stereotactic radiation induce immune-mediated survival advantage in murine intracranial glioma. J. Immunother. Cancer 2016;4:28. [DOI] [PMC free article] [PubMed] [Google Scholar]
- 34.Cohen J, Anvari A, Samanta S, et al. Mild hyperthermia as a localized radiosensitizer for deep-seated tumors: Investigation in an orthotopic prostate cancer model in mice. Br. J. Radiol 2019;92:20180759. [DOI] [PMC free article] [PubMed] [Google Scholar]
- 35.Iglesias VS, van Hoof SJ, Vaniqui A, et al. An orthotopic non-small cell lung cancer model for image-guided small animal radiotherapy platforms. Br. J. Radiol 2019;92:20180476. [DOI] [PMC free article] [PubMed] [Google Scholar]
- 36.Shi J, Udayakumar TS, Wang Z, et al. Optical molecular imaging-guided radiation therapy part 1: Integrated X-ray and bioluminescence tomography. Med. Phys 2017;44:4786–4794. [DOI] [PubMed] [Google Scholar]
- 37.Shi J, Udayakumar TS, Xu K, et al. Bioluminescence tomography guided small-animal radiation therapy and tumor response assessment. Int. J. Radiat. Oncol. Biol. Phys 2018;102:848–857. [DOI] [PubMed] [Google Scholar]
- 38.Wirtzfeld LA, Wu GJ, Bygrave M, et al. A new three-dimensional ultrasound microimaging technology for preclinical studies using a transgenic prostate cancer mouse model. Cancer Res 2005;65:6337–6345. [DOI] [PubMed] [Google Scholar]
- 39.Sha W, Ye H, Iwamoto KS, et al. Factors affecting tumor 18F-FDG uptake in longitudinal mouse PET studies. EJNMMI Res. 2013;3:51. [DOI] [PMC free article] [PubMed] [Google Scholar]
- 40.Dai L, Lu CD, Yu X, et al. Construction of orthotopic xenograft mouse models for human pancreatic cancer. Exp. Ther. Med 2015;10:1033–1038. [DOI] [PMC free article] [PubMed] [Google Scholar]
- 41.Lee CJ, Spalding AC, Ben-Josef E, et al. In vivo bioluminescent imaging of irradiated orthotopic pancreatic cancer xenografts in nonobese diabetic-severe combined immunodeficient mice: A novel method for targeting and assaying efficacy of ionizing radiation. Transl. Oncol 2010;3:153–159. [DOI] [PMC free article] [PubMed] [Google Scholar]
- 42.Hruban RH, Maitra A, Goggins M. Update on pancreatic intraepithelial neoplasia. Int. J. Clin. Exp. Pathol 2008;1:306–316. [PMC free article] [PubMed] [Google Scholar]
- 43.Dehghani H, Guggenheim JA, Taylor SL, et al. Quantitative bioluminescence tomography using spectral derivative data. Biomed. Opt. Express 2018;9:4163–4174. [DOI] [PMC free article] [PubMed] [Google Scholar]
- 44.Naser MA, Patterson MS, Wong JW. Algorithm for localized adaptive diffuse optical tomography and its application in bioluminescence tomography. Phys Med Biol 2014;59:2089–2109. [DOI] [PMC free article] [PubMed] [Google Scholar]
Associated Data
This section collects any data citations, data availability statements, or supplementary materials included in this article.


