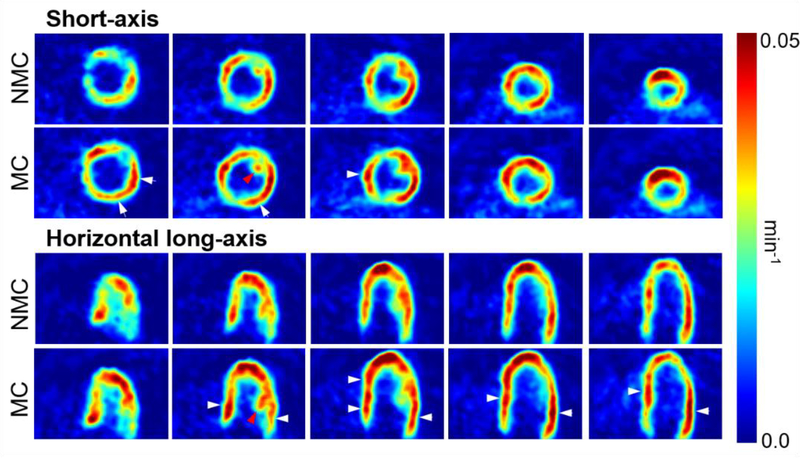
Figure 10:
Short-axis and horizontal long-axis Ki slices obtained using MC and NMC dynamic images for subject 2. MC yielded higher Ki values than NMC, especially in regions evidenced by the white arrows. Structures such as papillary muscles are also easier to delineate in MC Ki maps (see red arrows).

