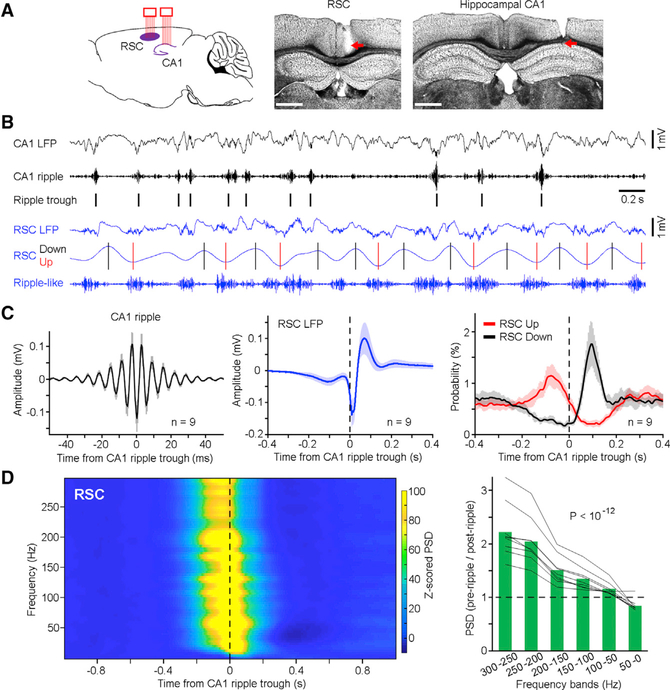
Figure 1. Coordinated Hippocampal Ripples and RSC Oscillations.
(A) Left, schematic drawing of dual-site multitetrode recording in the hippocampal CA1 and RSC. Two bundles of tetrodes (eight each) were implanted into the two regions. Middle and right, representative coronal sections showing recording sites in the granular RSC and hippocampal CA1, respectively. Scale bars, 0.1 mm.
(B) Representative simultaneously recorded CA1 and RSC LFPs (black and blue, respectively) and band-pass filtered oscillations (ripple: 150–250 Hz; up/down: 1–4 Hz, where black and red bars indicate peaks and troughs, respectively. Both were used for analyses in C, right).
(C) Left and middle, mean CA1 ripples ± SD and mean RSC LFPs ± SD, respectively, in relation to CA1 ripple trough (n = 9 mice). Right, mean probability of RSC Up/Down states ± SD in relation to CA1 ripple trough (n = 9 mice). SD, standard deviation.
(D) Left, mean peri-ripple spectrogram of RSC LFPs in relation to CA1 ripple trough (n = 9 mice). PSD, power spectral density. Z score transform was based on mean and SD calculated between − 1 and −0.5 s (see STAR Methods). Right, ratio of pre-ripple (−0.2–0 s) to post-ripple (0−0.2 s) RSC PSD at each frequency band. Green bars indicate the mean; gray lines indicate individual mice (n = 9). One-way ANOVA revealed a decrease of ratio across frequency bands (F(5,40) = 26.58, p< 10−12). See also Figures S1 and S2.

