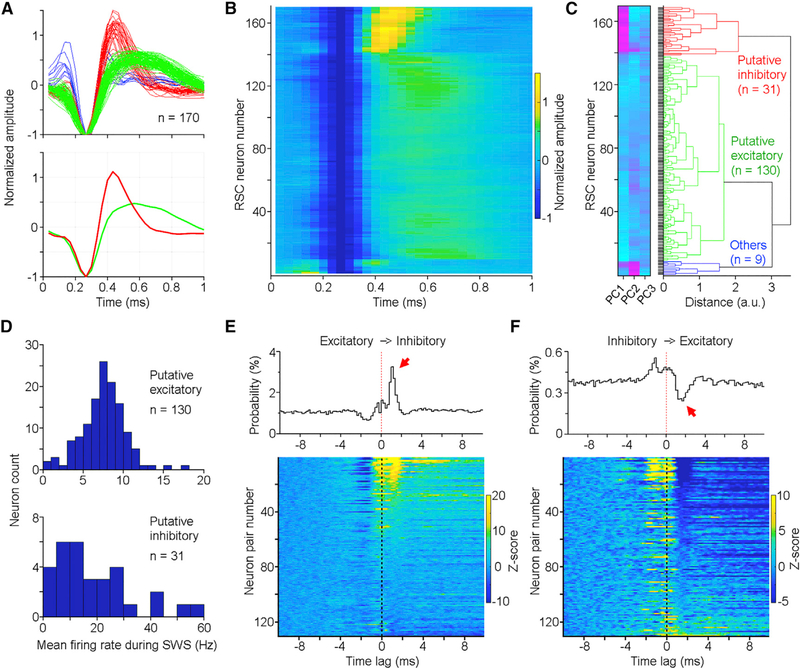
Figure 2. RSC Putative Excitatory and Inhibitory Neurons.
(A) Normalized spike waveforms of RSC neurons individually (top; n = 170) and averaged (bottom). Red, green, and blue correspond to putative inhibitory, excitatory, and other neurons, respectively.
(B) Spike waveform heatmap of the same 170 RSC neurons as shown in (A).
(C) Principal-component analysis(PCA) classifies RSC neurons into putative inhibitory (red; n = 31), excitatory (green; n = 130), and others (blue; n = 9). Neurons in (B) and (C) are arranged in the same order. PC1, PC2, and PC3 represent the first three principal components color coded from low (turquoise) to high scores (magenta).
(D) Mean firing rate distribution of RSC putative excitatory (top) and inhibitory (bottom) neurons during SWS.
(E and F) Cross-correlations between RSC putative excitatory and inhibitory neurons. Top panels, cross-correlation histograms of two representative neuron pairs; bottom panels, cross-correlation histogram heatmaps of individual neuron pairs (n = 130 pairs; only neuron pairs recorded from different tetrodes were used in this analysis; inhibitory neurons were used as the reference in E, and excitatory neurons were used as the reference in F). Color bars indicate z-scored firing probability, and neurons are arranged from high-to-low firing in (E) and low-to-high firing in (F) based on a time window of 1−2 ms. Z score transform was based on mean and SD calculated between −10 and −5 ms.
See also Figure S3.

