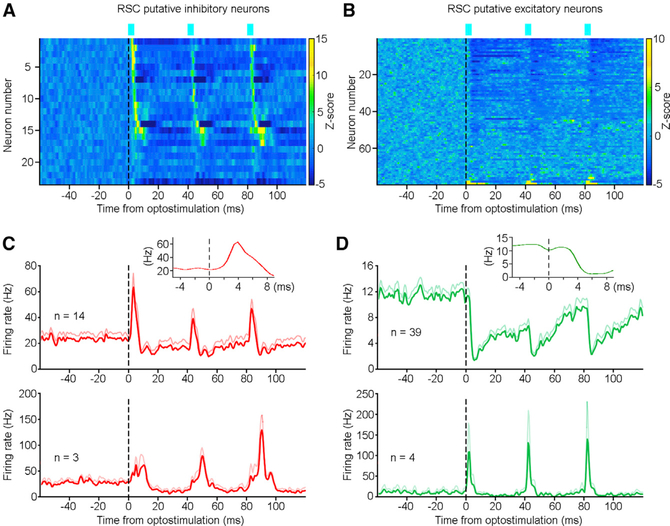
Figure 5. A Monosynaptic Hippocampus-to-RSC Innervation.
(A and B) Activity heatmap of RSC putative inhibitory (A) (n = 23) and excitatory (B) (n = 79) neurons upon optostimulation of the dorsal hippocampus-to-RSC terminals. Color bars indicate z-scored firing probability; z-score transform was based on mean and SD calculated between −60 and 0 ms.
(C) Mean activity (red lines) and SEM (light red lines) of fast-response (top; n = 14) and slow-response (bottom; n = 3) RSC putative inhibitory neurons upon optostimulation. The fast- and slow- response latencies ranged between 2.5−6 and 9.5−10 ms, respectively. Inset, mean firing of the fast-response RSC neurons (n = 14) peaked at ~4 ms upon optostimulation.
(D) Mean activity (green lines) and SEM (light green lines) of inhibited (top; n = 39) and activated (bottom; n = 4) RSC putative excitatory neurons upon optostimulation. Inset, mean firing of the inhibited RSC neurons (n = 39) troughed at ~6 ms upon optostimulation.
Laser: three pulses at 25 Hz; pulse width, 3 ms; power, ~1 mW. See also Figure S5.

