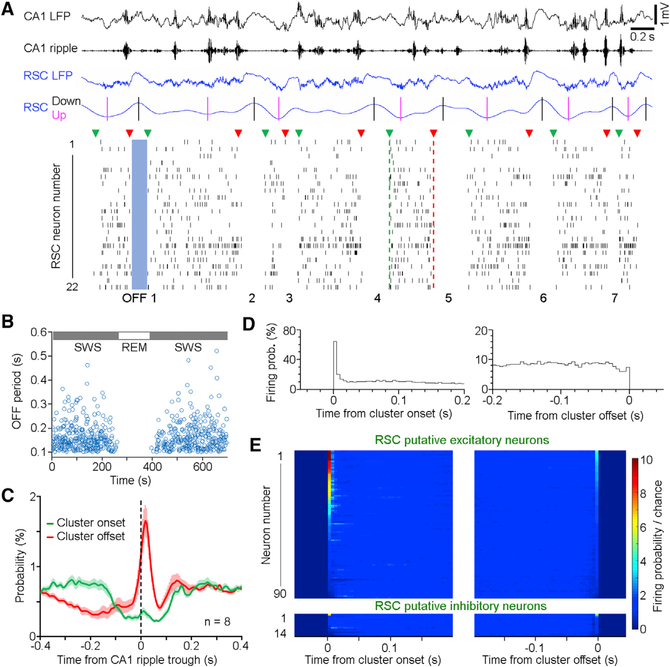
Figure 6. Clusters of RSC Activity Co-terminate with Hippocampal Ripple.
(A) Representative simultaneously recorded CA1/RSC oscillations (top; black/blue, respectively; up/ down: 1–4 Hz, where black and magenta bars indicate peaks and troughs, respectively) and spikes of 22 RSC neurons (bottom; neurons 4, 15, and 16 are putative inhibitory, whereas the rest are putative excitatory neurons). RSC neurons fired in clusters with an “ON-OFF” cyclic pattern: green triangles indicate cluster onsets; red triangles indicate cluster offsets. An OFF period is defined by none of the RSC neurons firing within a period of 0.1 s or longer.
(B) Durations of OFF periods (blue circles) during SWS and REM sleep. No OFF period was detected during REM.
(C) Mean probability ± SEM of RSC cluster onsets (green) and offsets (red) in relation to CA1 ripple trough.
(D) Firing probability of one RSC putative excitatory neuron in relation to the onset (left) and offset (right) of RSC clusters.
(E) Normalized firing probability of RSC putative excitatory (top; n = 90) and inhibitory neurons (bottom; n = 14) in relation to RSC cluster onsets/offsets. Chance was defined by shuffled spike firing probability. Neurons are arranged from high to low firing based on the time window of 0−5 ms.
See also Figure S6.

