
Table 5.
SAR Trends Illustrated by 2D Matrices: Efficacy at MOR and DOR
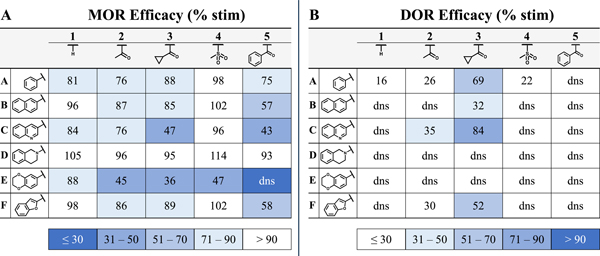 |
(A) SAR matrix highlights trends in MOR efficacy. Darker shades of blue correspond to lower efficacy (least desirable) whereas those with white background are most efficacious. (B) DOR efficacy matrix displays ligands with the highest efficacy (least desirable) in blue whereas antagonists or low-efficacy agonists are shown in white. dns = does not stimulate.