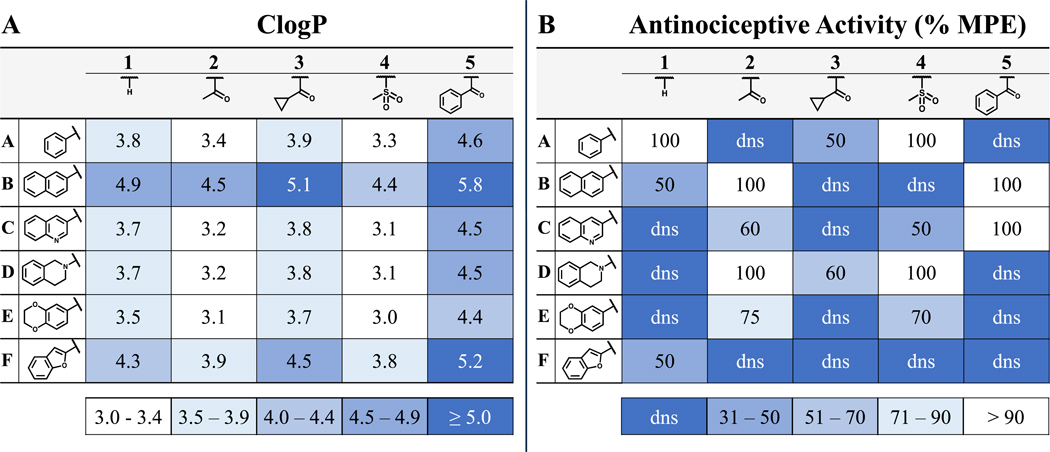
Table 6.
2D Matrix Indicates Low ClogP is Favorable for Achieving Antinociceptive Activity
 |
(A) Ligand matrix indicates trends in lipophilicity, as measured by ClogP. Compounds with highest ClogP (least desirable) are displayed in darker shades of blue whereas more polar analogues are shown in white. (B) Antinociceptive activity, measured by the WWTW assay, is displayed as the percent maximal possible effect (%MPE). Compounds with the least antinocicetive activity in this assay (least desirable) are depicted in darker shades of blue whereas those with the highest activity are shown in white.
