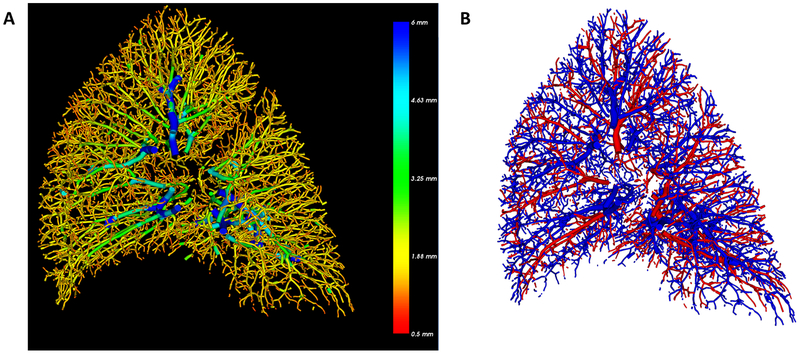
Figure 4.
Example of 3D reconstruction of a right lung (A) where blue indicates larger (radius of 6mm and cross sectional area of ~110mm2) and red indicates smaller vessels with radius of 0.5mm and cross sectional area of 0.8mm2 (B) shows the subsequent automated arterial and venous segmentation where blue denotes arteries and red denotes veins.

