
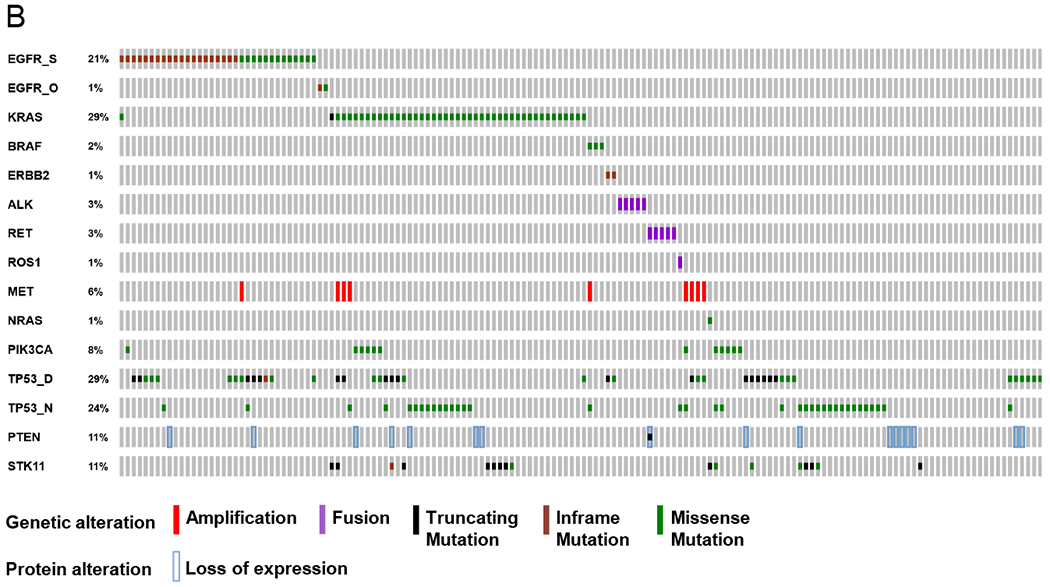
Figure 1. Mutations and co-mutation plot in LCMC II.
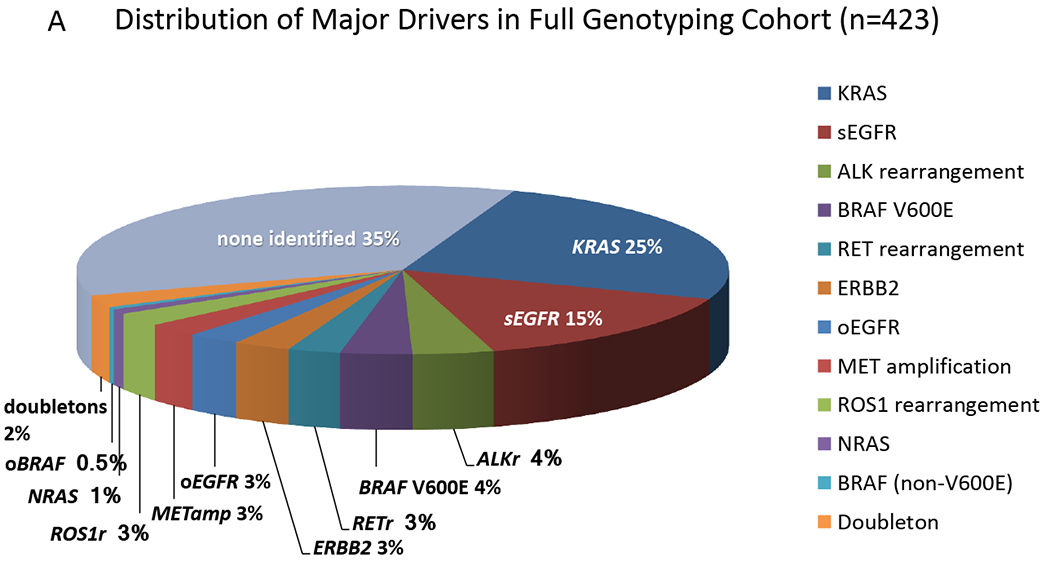
A. Distribution of Oncogenic Drivers in Full Genotyping Cohort. The relative proportion of the various driver mutations are shown for the 423 subjects with complete testing for 12 genes. No AKT1 orMAP2K1 mutations were detected in this set. sEGFR = sensitizing EGFR mutation; oEGFR = other EGFR mutations; ALKr, RETr, and ROS1r denote rearrangements in the respective genes; METamp denotes amplification of MET; oBRAF denotes a mutation other than V600E; and doubletons denotes samples with two or more of the oncogenic drivers shown here.
B. Co-mutation plot.Genetic and expression alterations in the 14 core genes plus key tumor suppressor genes in 154 lung adenocarcinomas with complete analysis. No AKT1 or MAP2K1 mutations were detected in this set. EGFR_S = sensitizing EGFR mutations; EGFR_O = other EGFR mutations; TP53_D = disruptive alterations; TP53_N = nondisruptive alterations. Prepared using http://www.cbioportal.org/oncoprinter.jsp#.