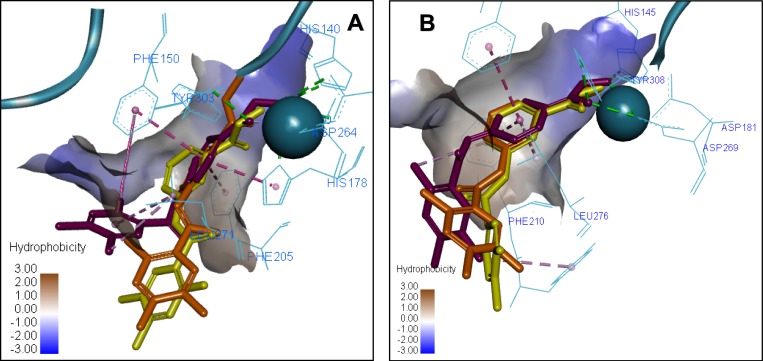
Figure 7.
Overlay of the 3D ligand binding poses of compounds 7a (purple), 8a (orange) and 8b (yellow) in the HDAC1 (A) and HDAC2 (B) ligand-binding sites. The interacting residues are shown in line view, Zn ion is shown as a sky blue sphere. Dotted lines are used to visualize the protein–ligand interactions. Image prepared in Discovery Studio Visualizer.

