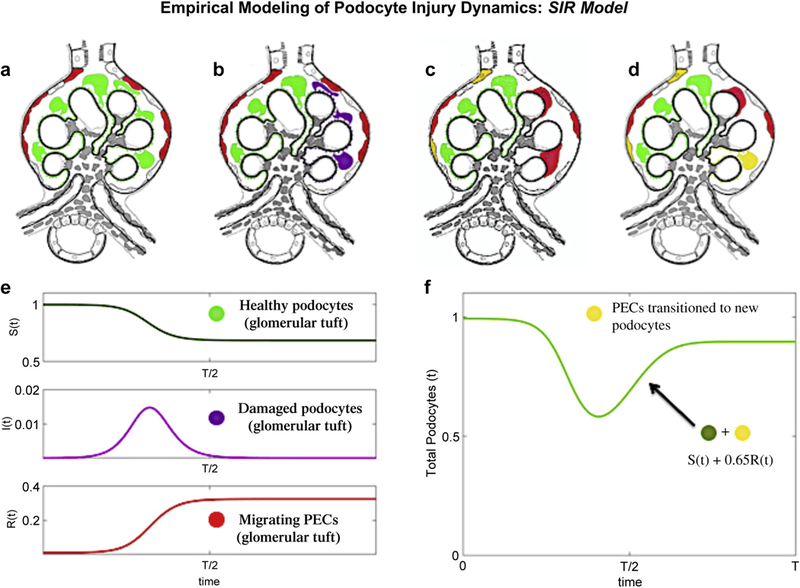
Figure 10|. Empirical modeling of podocyte injury dynamics: susceptible, infected, and recovery (SIR) model.

(a-d) Schema of parietal epithelial cell (PEC) migration from Bowman’s capsule to the glomerular tuft. (a) Labeling of PECs (red) on Bowman’s capsule and podocytes (green) within the normal glomerular tuft before disease onset. (b) After induction of focal segmental glomerulosclerosis (FSGS), podocytes on the glomerular tuft are injured/lost (purple). (c) Podocyte injury/loss induces migration of PECs from Bowman’s capsule to the glomerular tuft (red). (d) Approximately 65% of red PECs convert (transdifferentiate) to yellow podocytes. (e) SIR dynamics for b = 0.4 and k = 1/3. The dynamics mirror qualitatively what is observed for injured podocytes and their recovery through the migration of PECs into the glomerulus and their transdifferentiation to podocytes. Note the color coding of the dynamics is consistent with panels (a-d). (f) Graphical illustration of podocyte number change during FSGS: total number of podocytes in the glomerular tuft, which is a sum of the green and yellow podocytes.
