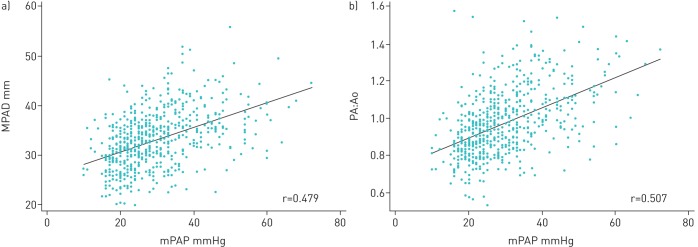
FIGURE 2.
Scatterplot and regression lines for the relationship between a) inspiratory main pulmonary artery (PA) diameter (MPAD) and mean PA pressure (mPAP) from right heart catheterisation and b) inspiratory ratio of the diameter of the PA to the diameter of the ascending aorta (PA:Ao) as measured on high-resolution computed tomography scan and mPAP.

