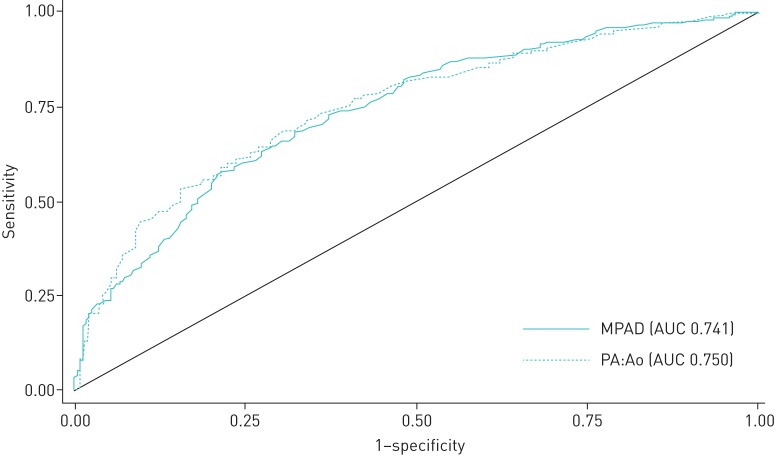
FIGURE 3.
Receiver operating characteristic (ROC) curves showing the sensitivity and specificity of main pulmonary artery (PA) diameter (MPAD) and ratio of the diameter of the PA to the diameter of the ascending aorta (PA:Ao) as predictors of pulmonary hypertension when mean PA pressure ≥25 mmHg. AUC: area under the ROC curve.

