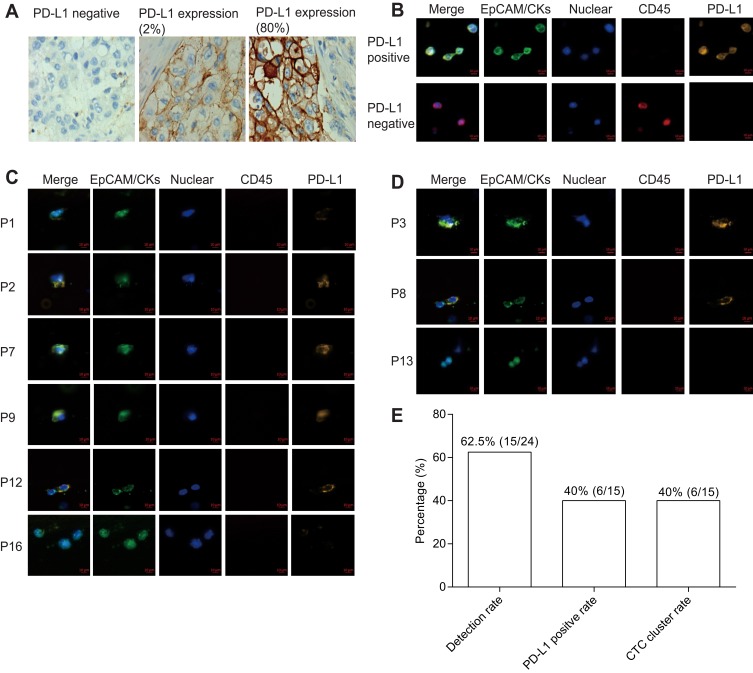
Figure 3.
PD-L1 expression and CTC cluster analysis. (A) PD-L1 expression in tumor tissue. (B) PD-L1 expression in CTC of cancer patients (bar = 10 μm). (C) Immuno-staining differentiates PD-L1 expression in positive and negative control (bar = 10 μm). (D) Represent CTC cluster in patients. (E) Detection rate, CTC cluster rate and PD-L1 positive rate (≥1 PD-L1+ CTC) of lung cancer patients.

