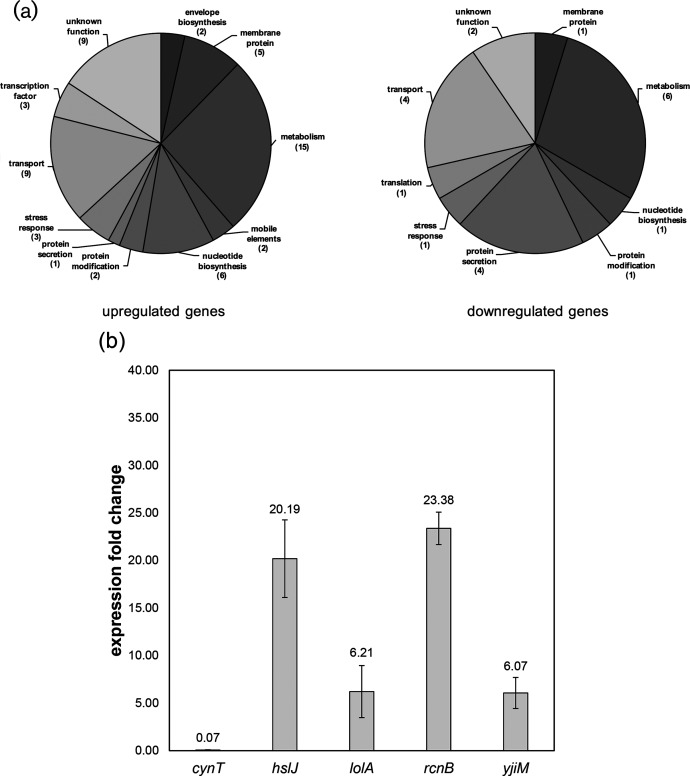
Fig. 7.
Differential gene expression is induced in the lnt mutant. (a) Transcriptional profile of lnt mutants shows gene upregulation (57 genes) and downregulation (21 genes). Pie charts summarize the data found in Table S3, using a differential expression threshold of five-fold, P≤0.01. (b) qPCR confirmation of a subset of genes with altered expression when lnt function is disrupted. Changes in expression of the indicated genes in A. baylyi are represented as fold change in the lnt mutant as compared to wild-type, using the 16S rRNA gene as the housekeeping control gene. Numbers above the bars are the average values of biological triplicates, with error bars indicating standard deviation from the mean.

