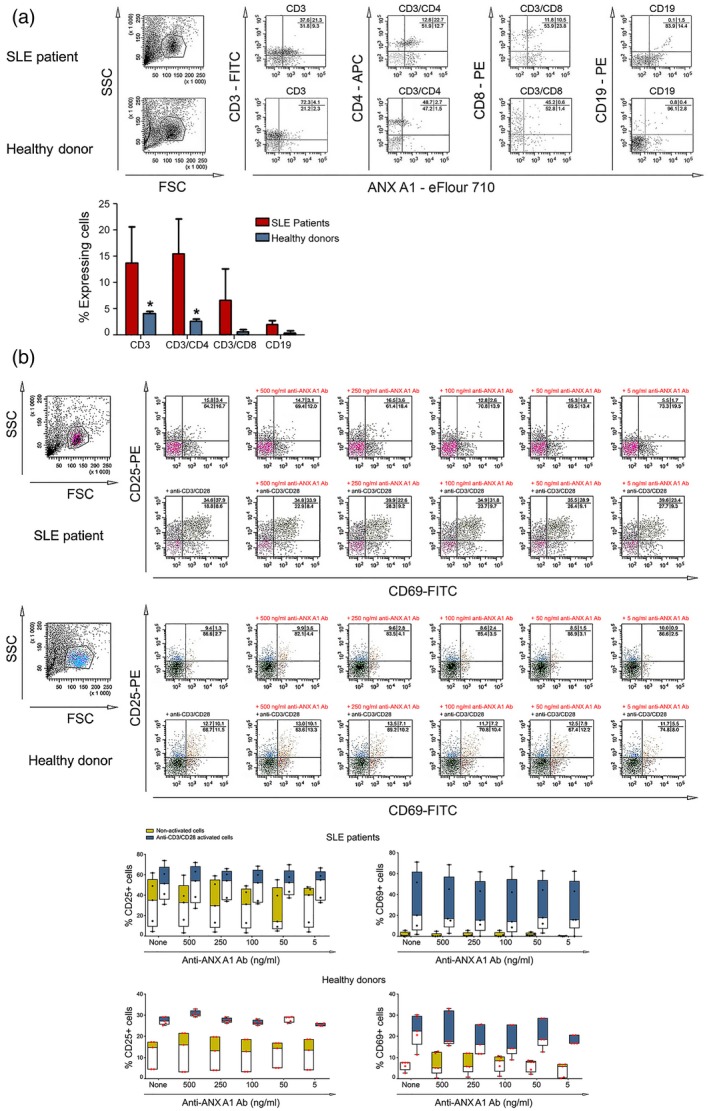
Figure 1.

Flow cytometric analyses. (a) Detection of annexin A1 (ANX A1) surface expression. (b) Expression of T cell activation markers is affected by anti‐ANX A1 antibody. Representative data of five experiments are shown (left parts). The extracted results from all experiments are presented graphically (right parts). The data from five systemic lupus erythematosus (SLE) patients and five healthy donors are represented as mean ± standard deviation (n = 5, *P < 0·05).
