
Figure 2.
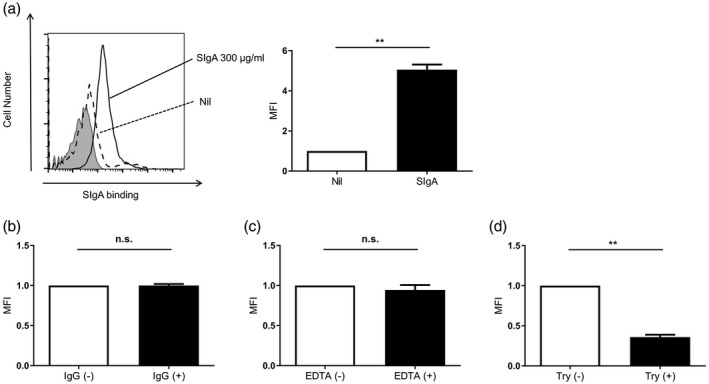
Secretory immunoglobulin A (SIg)A bound to the surface of A549 cells. A549 cells were incubated with SIgA at 300 µg/ml (solid line) or without SIgA dashed line), followed by staining with allophycocyanin (APC)‐conjugated anti‐IgA antibody. The shaded area shows cells without staining. Representative histograms from three independent experiments are shown. Mean fluorescence intensity (MFI) of the histograms from three independent experiments are shown as relative values to those of cells incubated without SIgA (□). Bars represent the standard error of the mean (s.e.m.). **P < 0·01. (b) A549 cells were incubated with SIgA at 300 µg/ml and with (■) or without (□) IgG at 300 µg/ml. The cells were stained and analyzed as described above. MFI of the histograms from three independent experiments are shown as relative values to those of cells incubated without (□) IgG. Bars represent the s.e.m.; n.s. = not significant. (c) A549 cells were incubated with SIgA at 300 µg/ml and with (■) or without (□) ethylenediamine tetraacetic acid (EDTA). The cells were stained and analyzed as described above. MFI of the histograms from three independent experiments are shown as relative values to those of cells incubated without (□) EDTA. Bars represent the s.e.m.; n.s. = not significant. (d) After the treatment with (■) or without (□) trypsin, A549 cells were incubated with SIgA at 300 µg/ml. The cells were stained and analyzed as described above. MFI of the histograms from three independent experiments are shown as relative values to those of cells without trypsin treatment (□). Bars represent the standard error of the mean (s.e.m.). **P < 0·01.