Figure 5.

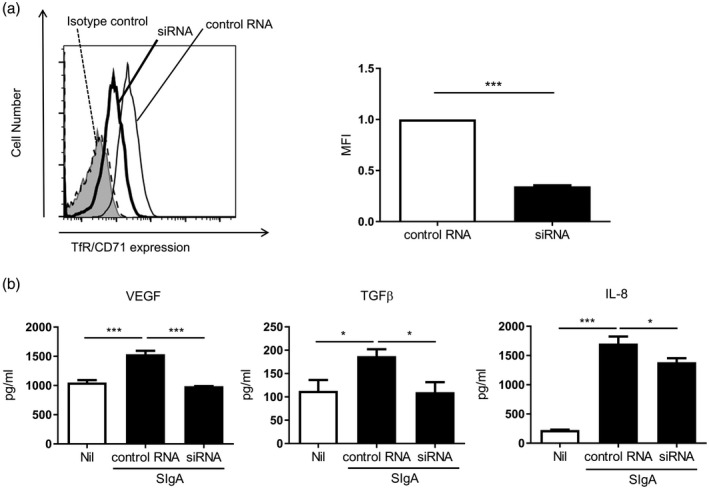
Knock‐down experiments on transferrin receptor (TfR)/CD71. (a) A549 cells were transfected with TfR/CD71 siRNA (bold line) or negative control RNA (solid line). The cells were stained with specific antibody for TfR/CD71 or with isotype control antibody (dashed line) and analyzed by flow cytometry. Representative histograms from three independent experiments are shown. The shaded area shows cells without staining. Mean fluorescence intensity (MFI) of the histograms from three independent experiments are shown as relative values. Bars represent the standard error of the mean (s.e.m.). ***P < 0·001. (b) After transfection with TfR/CD71 siRNA or control RNA, A549 cells were stimulated with secretory immunoglobulin A (SIg)A at 300 μg/ml for 24 h. The levels of vascular endothelial growth factor (VEGF), transforming growth factor (TGF)‐β and interleukin (IL)‐8 in the culture supernatant were measured. Bars represent the s.e.m. (n = 4–12); n.s. = not significant. *P < 0·05, **P < 0·01, ***P < 0·001.
