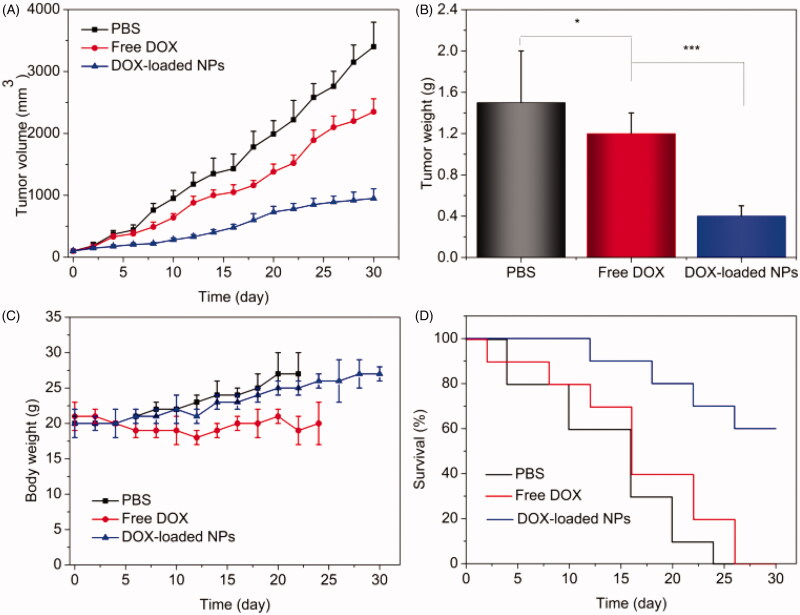
Figure 7.
Therapeutic efficacy of A549 tumor-bearing mice. (A) Tumor volume growth curves of different groups of mice after various treatments; (B) average weights of tumors collected from the mice at the end of therapy; (C) the weight of A549 tumor-bearing mice (n = 10, mean ± SD). *p< .05, ***p< .001. (D) Survival rates of mice after treatment. Statistical analysis was done using Kaplan–Meier’s method (n = 10).

