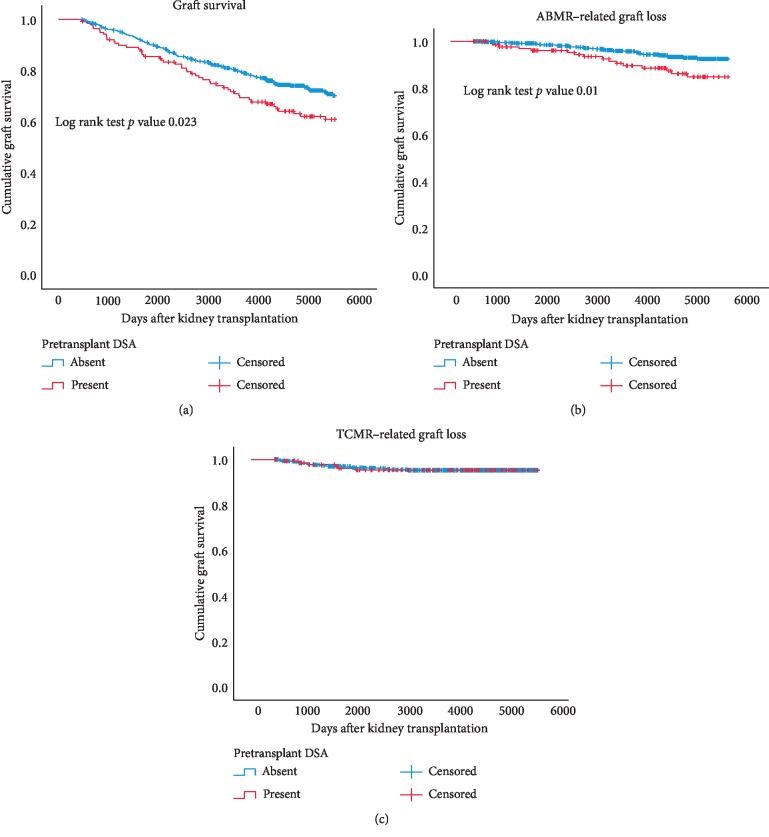
Figure 3.
Kaplan–Meier analysis of graft survival censored for death after the first year after transplantation (a). Graft loss because of antibody-mediated rejection (ABMR) or T cell-mediated rejection (TCMR) is shown in b and c. Separate survival curves are made for recipients with or without pretransplantation donor-specific anti-HLA antibodies (DSA present or absent). p values are obtained by log rank test statistics pairwise over strata.

