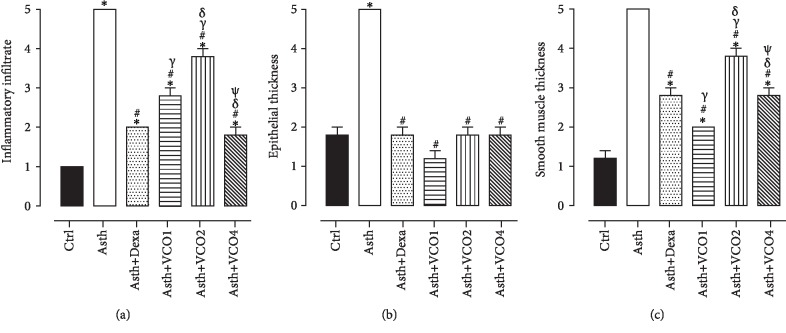
Figure 3.
Inflammatory cell infiltrate in lung (a), epithelial hyperplasia (b), and thickness of airway smooth muscle layer (c) of guinea pigs of Ctrl, Asth, Asth+Dexa, Asth+VCO1, Asth+VCO2, and Asth+VCO4 groups. The columns and vertical bars represent the mean and S.E.M., respectively (n = 5). One-way ANOVA followed by Tukey's post-test: ∗p < 0.05 (Ctrl vs. other groups); #p < 0.05 (Asth vs. other groups); γp < 0.05 (Asth+Dexa vs. Asth+VCO1 or Asth+VCO2); δp < 0.05 (Asth+VCO1 vs. Asth+VCO2 or Asth+VCO4) and ψp < 0.05 (Asth+VCO2 vs. Asth+VCO4).

