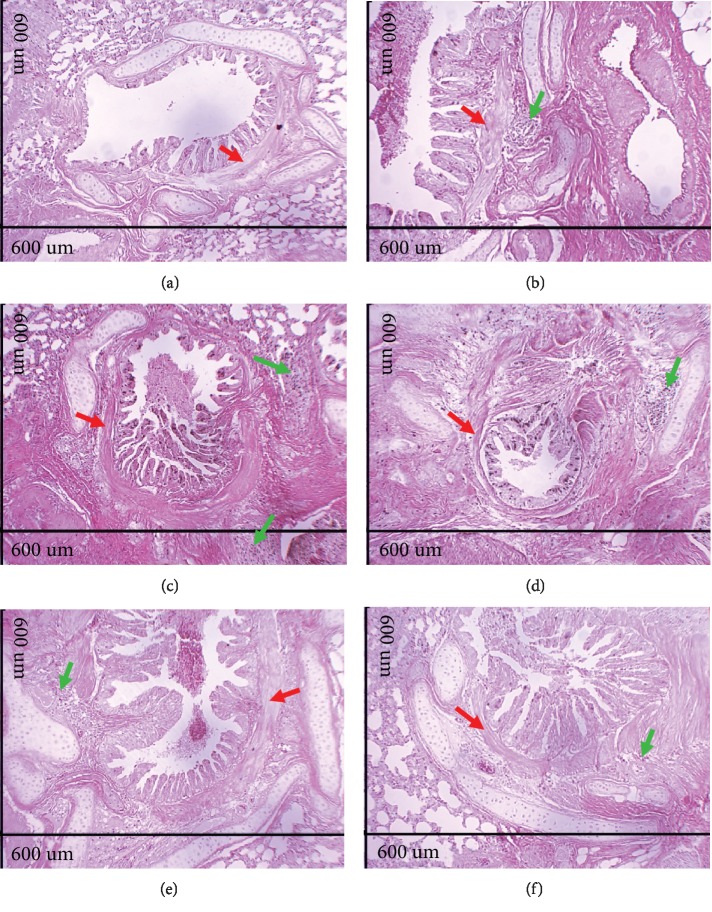
Figure 4.
Photomicrographs of lungs of guinea pigs from Ctrl (a), Asth (b), Asth+Dexa (c), Asth+VCO1 (d), Asth+VCO2 (e), and Asth+VCO4 groups (f) showing the smooth muscle of the intrapulmonary bronchi. Intrapulmonary bronchial smooth muscle (red arrows), inflammatory infiltrate (green arrows). HE, A.T. ×100, 600 μm.

