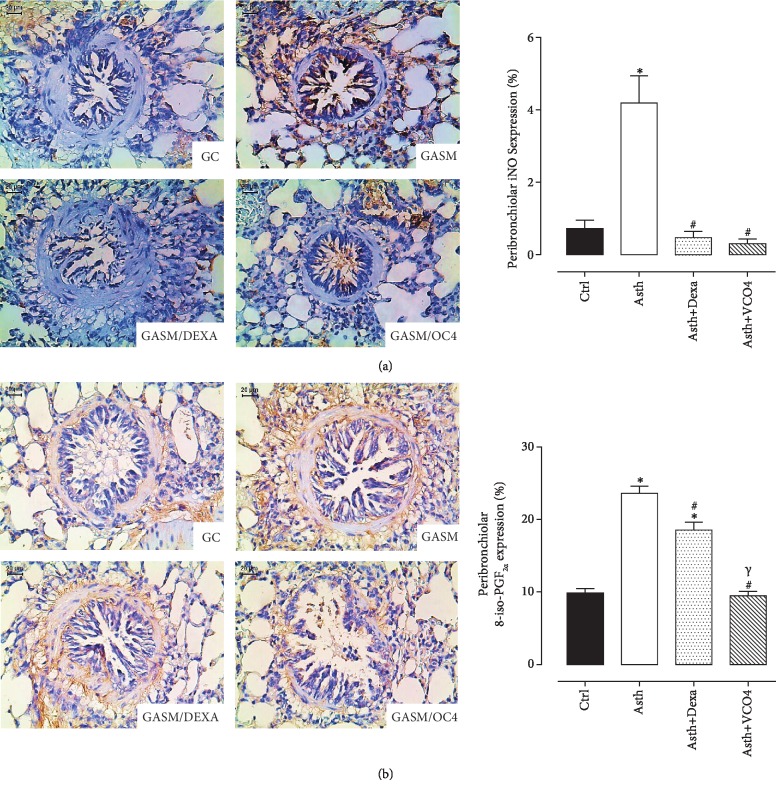
Figure 9.
Representative photomicrographs of airway stained with immunohistochemistry to detect iNOS (a) and isoprostane (b) in Ctrl, Asth, Asth+Dexa, and Asth+VCO4 experimental groups, and the graphs representing the mean and S.E.M. of each group for iNOS and isoprostane expression in the peribronchiolar wall. ANOVA followed by Tukey post-test: ∗p < 0.05 (Ctrl vs. all groups), #p < 0.05 (Asth vs. all groups), s (Asth+Dexa vs. Asth+VCO4).

