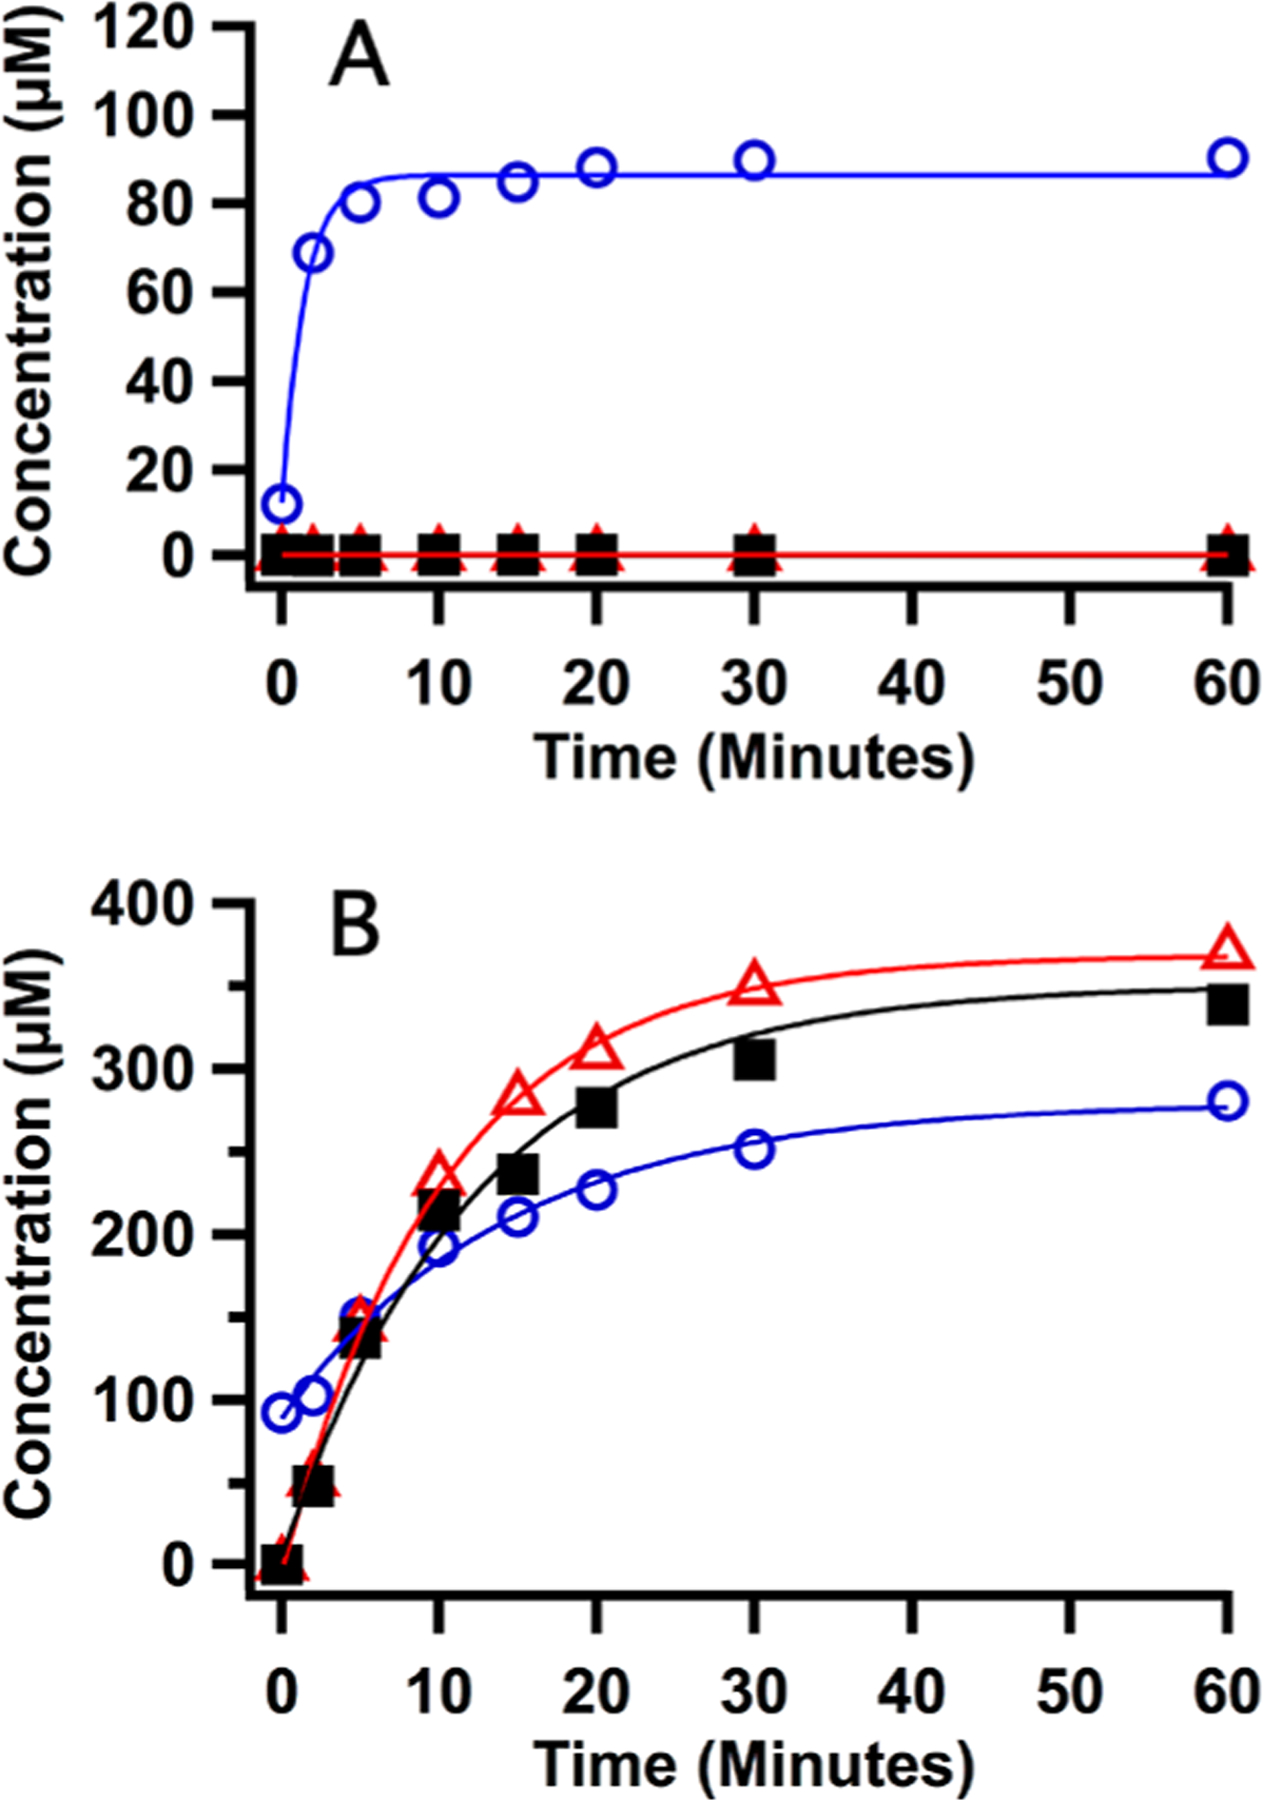
Figure 1.

LC/MS analysis of the progress of the Bt MiaB reaction.(A) Reconstituted Bt MiaB (165 μM) was incubated with SAM (600 μM) and tRNA substrate i6A (330 μM) for varying reaction times.(B) Reconstituted MiaB (165 μM) was incubated with SAM (600 μM) and tRNA substrate i6A (330 μM) for 20 min and then reacted with sodium dithionite for varying reaction times. Reaction was monitored by formation of the products SAH (blue circles), 5′-dAH (red triangles), and ms2i6A (black squares). Solid lines are fits to a first-order exponential using parameters mentioned in the text.
