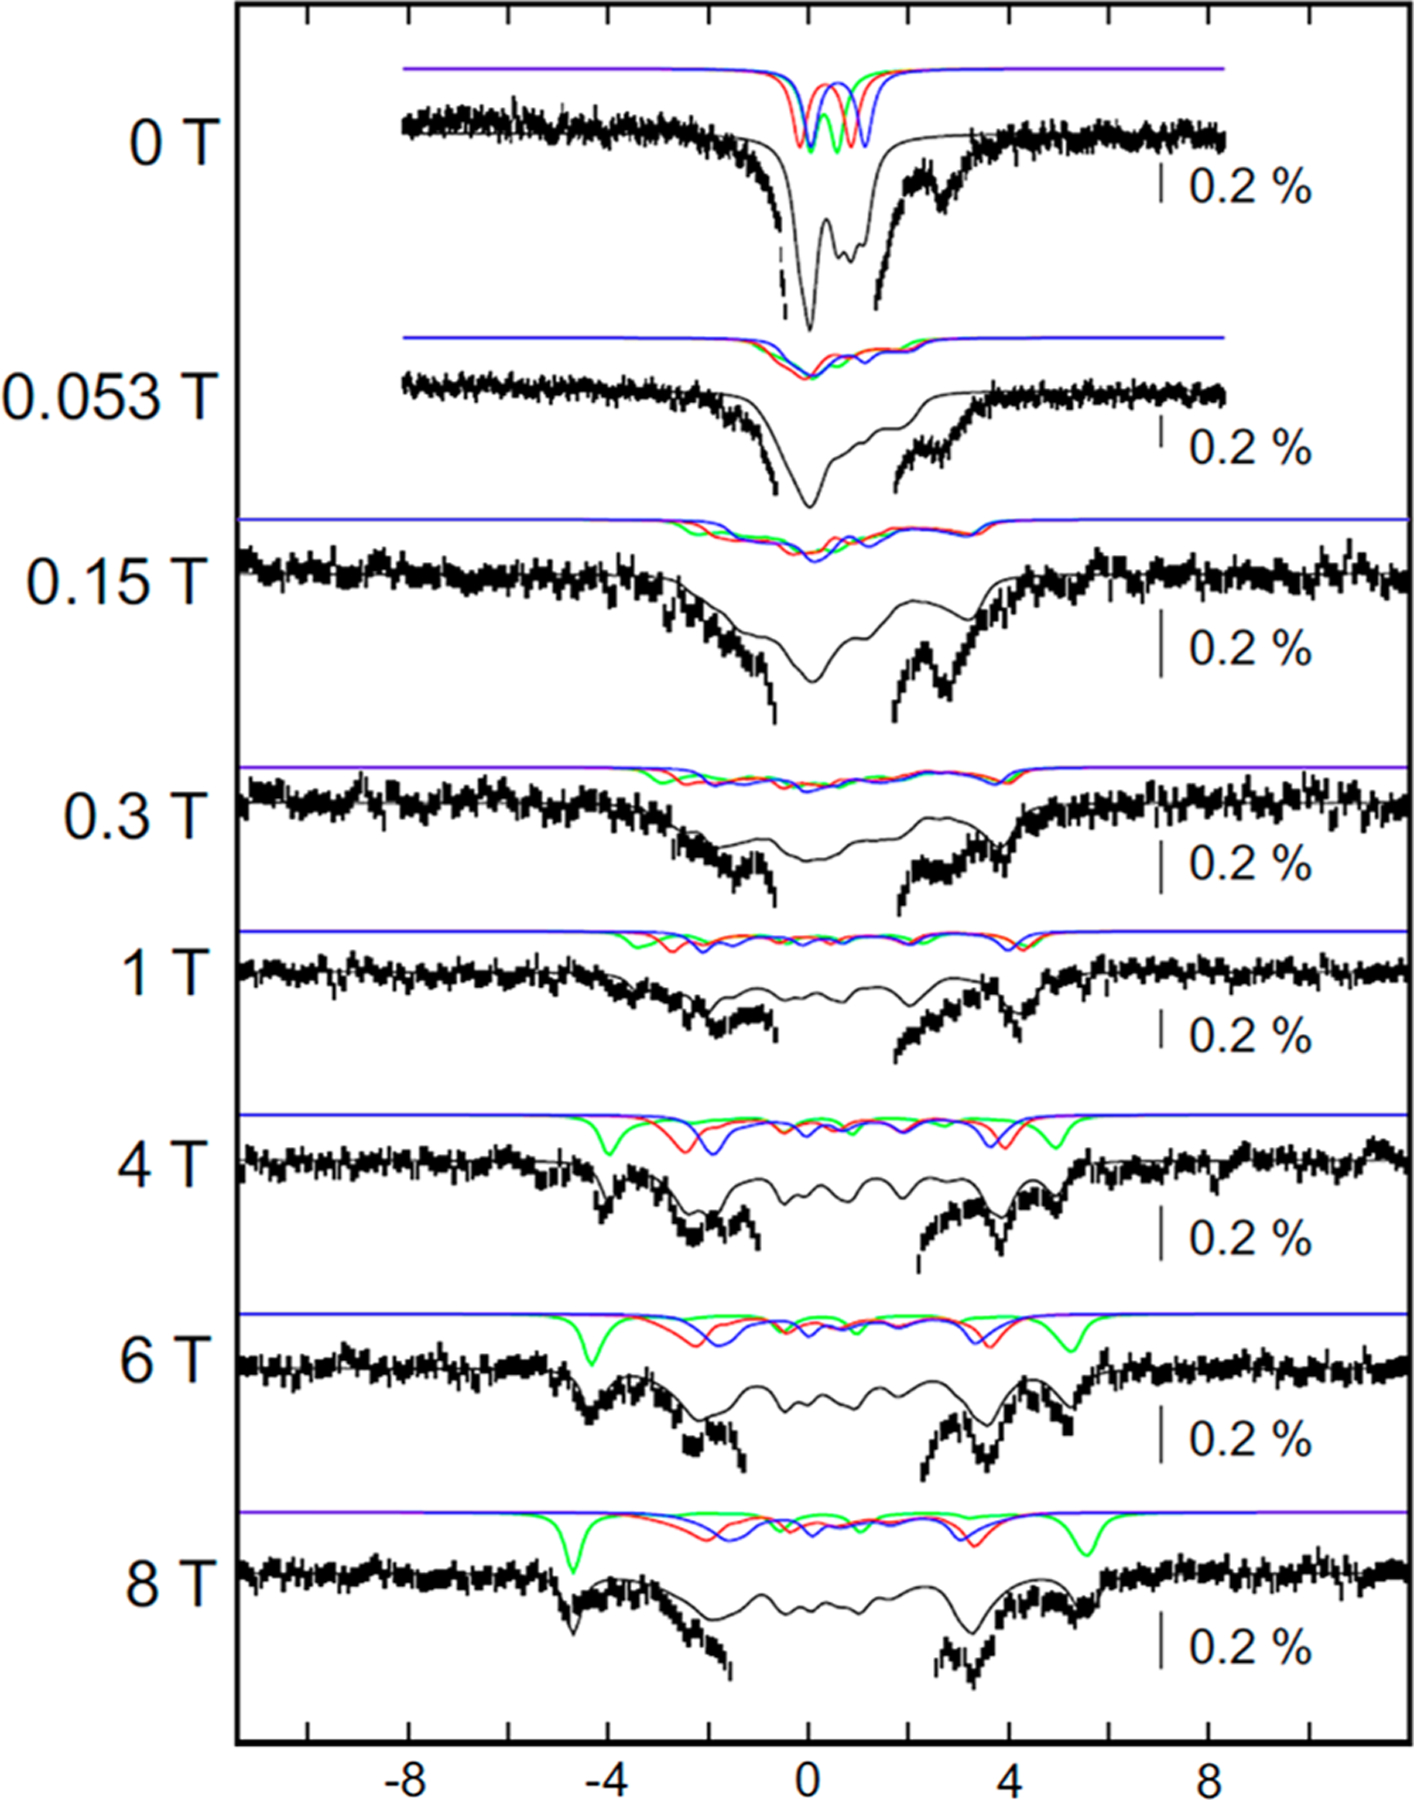
Figure 4.

The 4.2-K/variable-field Mössbauer spectra of a sample of reconstituted Bt MiaB incubated with SAM and tRNA substrate for 20 min. Experimental spectra are shown as vertical bars. Strength of the external magnetic field applied parallel to the γ beam is indicated for each spectrum. In all spectra, experimental data are shown as black vertical bars. Central region of the spectra is dominated by the features of the [4Fe-4S]2+ clusters and is cut off in order to amplify the weaker, magnetically split features associated with the [3Fe-4S]0-like cluster. Total simulations of the [3Fe-4S]0-like cluster are shown as black lines using the spin Hamiltonian parameters quoted in Table 2 (27% total intensity). Solid green, red, and blue lines are spin Hamiltonian simulations using the parameters in Table 2 of the unique FeIII site (site 1, 9% of total intensity, green lines), the “FeIII-like” site of the MV unit (site 2, 9% of total intensity, red lines), and the “FeII-like” site of the MV unit (site 3, 9% of total intensity, blue lines). Full spectra are shown in Figure S13A.
