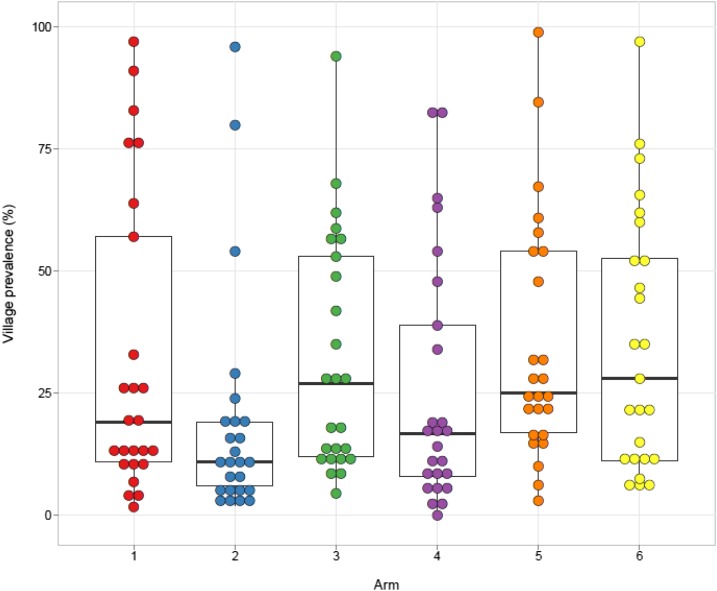
Figure 4.
Schistosoma mansoni infection prevalence in 9- to 12-year-old children at year 5 final evaluation. Each dot represents an individual village. Bars represent arm median, boxes represent the 25th and 75th percentiles, and whiskers represent 5th and 95th percentiles. This figure appears in color at www.ajtmh.org.

