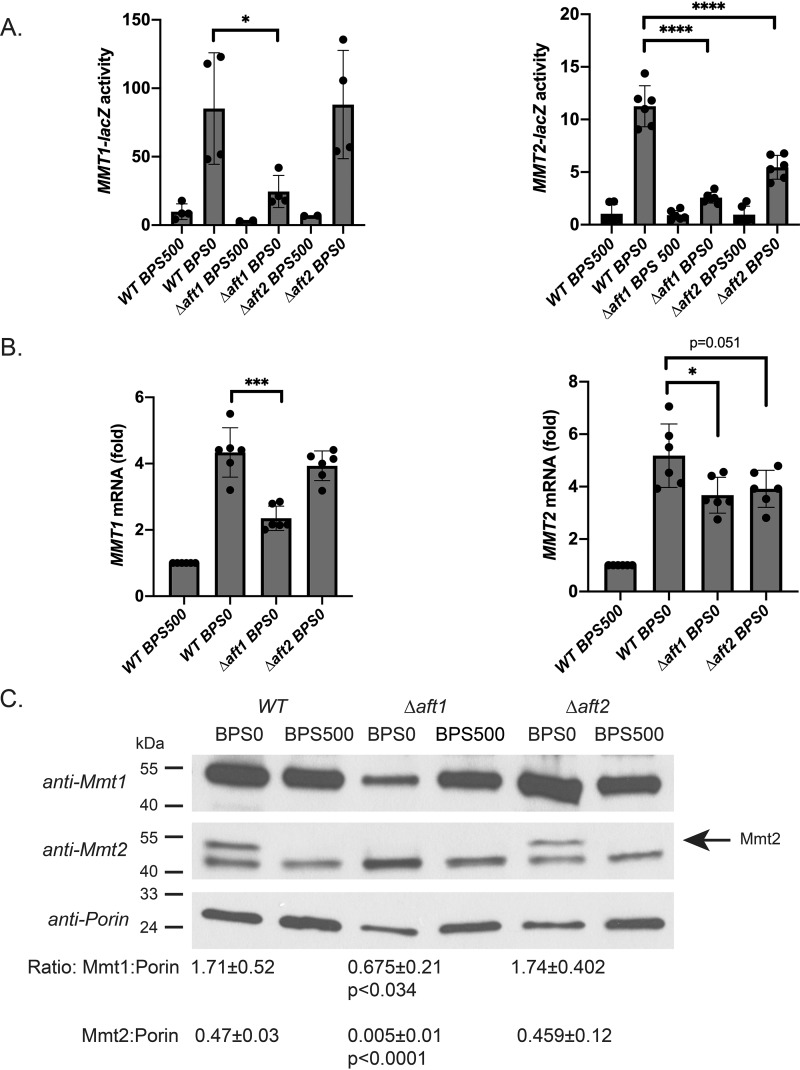
Figure 3.
Low-iron-induced MMT1 and MMT2 expression is mediated through Aft1. A, WT, Δaft1, and Δaft2 cells transformed with MMT1-lacZ or MMT2-lacZ were grown in CM medium treated with 80 μm BPS with or without 500 μm iron overnight, and β-gal activity was measured. Error bars represent S.D. n = 4. B, RT-qPCR was performed for MMT1, MMT2, and CMD1 from cells as in A, using primers listed in Table 2. Error bars represent S.D. n = 6. C, crude mitochondria were isolated from cells as in A, and Mmt1, Mmt2, and Porin levels were determined using Western blot analysis. Representative blots are shown and quantified as described under “Experimental procedures.” n = 3. The arrow identifies the Mmt2-specific band. *, p ≤ 0.05; ***, p ≤ 0.001; ****, p ≤ 0.0001.

