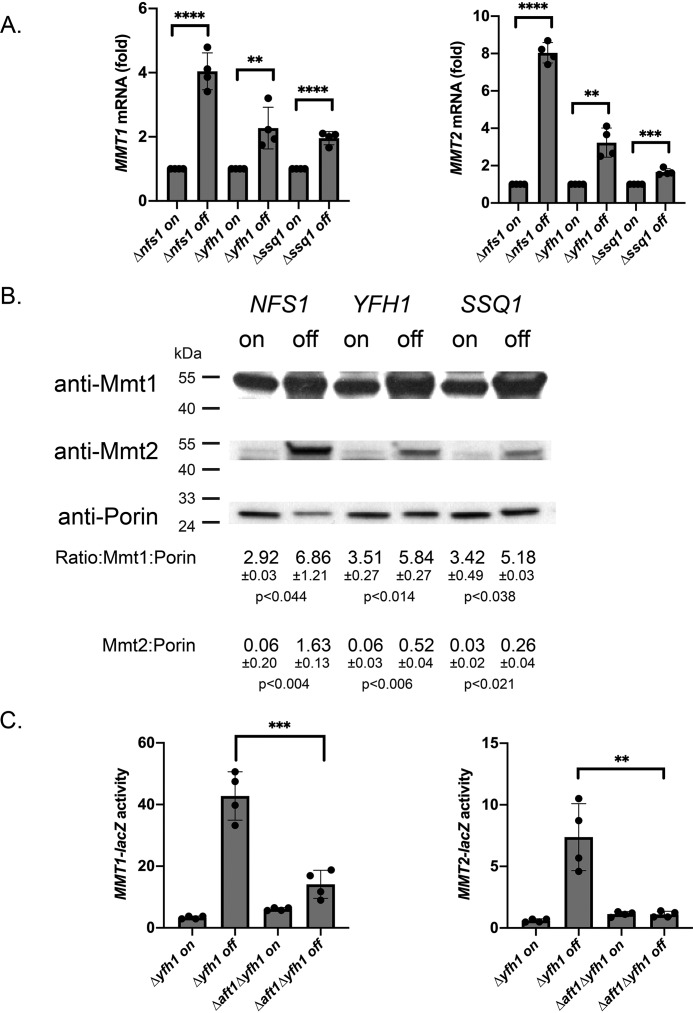
Figure 5.
Loss of Fe–S cluster synthesis induced MMT1 and MMT2 expression. A, Δnfs1pMET3NFS1, Δyfh1pMET3YFH1, and Δssq1pMETSSQ1 cells were grown without methionine (on) or with 10× (20 mm) methionine (off) overnight, and RT-qPCR for MMT1, MMT2, and ACT1 was performed. Error bars represent S.D. n = 4. B, mitochondria were isolated from cells grown as in A, and the levels of Mmt1, Mmt2, and Porin were determined by Western blot analysis. n = 3. C, Δyfh1pMET3YFH1 or Δaft1Δyfh1pMET3YFH1 cells transformed with MMT1-lacZ or MMT2-lacZ were grown as in A, and β-gal activity was measured. Error bars represent S.D. n = 4. **, p ≤ 0.01; ***, p ≤ 0.001; ****, p ≤ 0.0001.

