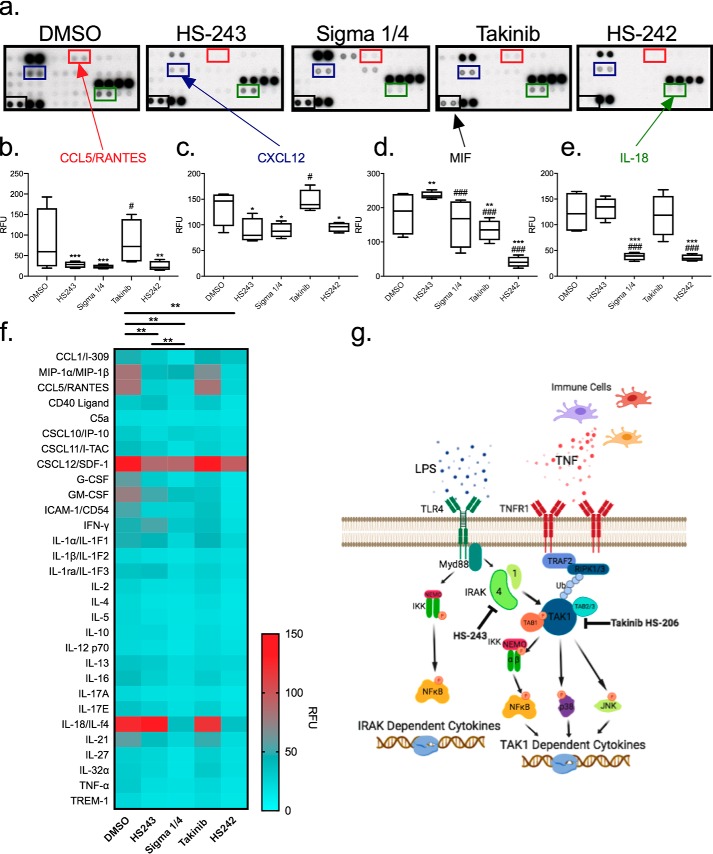
Figure 6.
IRAK-1/4 inhibition has distinct cytokine profile from TAK1. Human RA-FLSs were stimulated with LPS and treated with either DMSO, HS-243, Sigma 1/4, takinib, or HS-242 at 10 μm for 24 h before cytokine profiling. a, representative cytokine proteome arrays with indicted cytokine positioning. b–e, quantification of CCL5 (b), CXCL12 (c), MIF (d), and IL-18 (e) expression. *, differences between DMSO and treatment; #, difference from HS-243. The data points represent means ± S.E. (n = 4). f, heat map of 30 cytokines/chemokines expression. g, schematic of IRAK-1/4 and TAK1 signaling. *, p < 0.05; **, p < 0.01; ***, p < 0.001.

