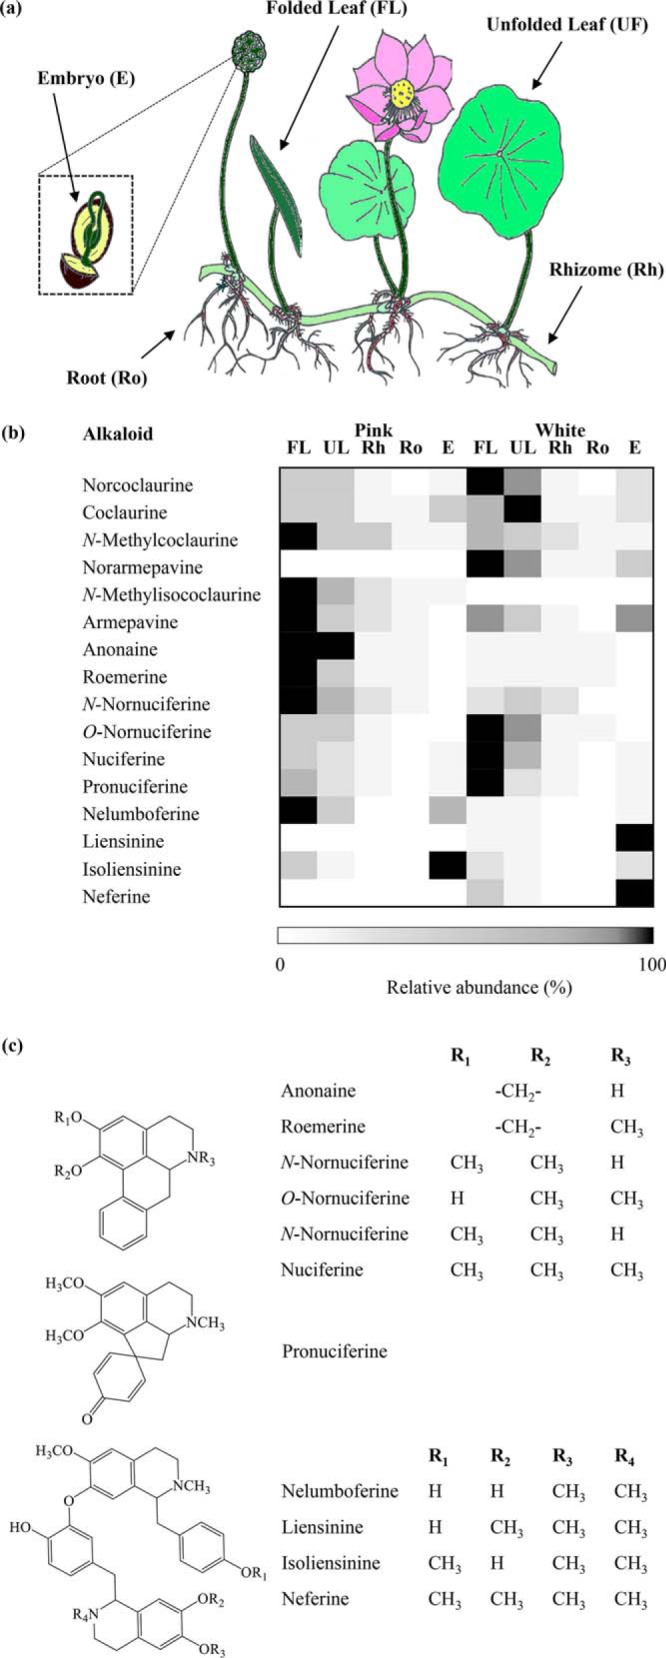
Figure 2.

(a) Diagram of sacred lotus. (b) Heat map showing the organ-specific profile of BIAs in two varieties of sacred lotus (Pink and White). Relative abundance corresponds to the mean value of three independent replicates. Values were normalized to the sample with the highest level for each compound. (c) Structures corresponding to detected aporphine, pro-aporphine, and bisbenzylisoquinoline alkaloids isolated from sacred lotus (for 1-benzylisoquinoline alkaloid structures refer to Fig. 1). FL, folded leaf; UL, unfolded leaf; Rh, rhizome; Ro, roots; E, embryos.
