Figure 3.

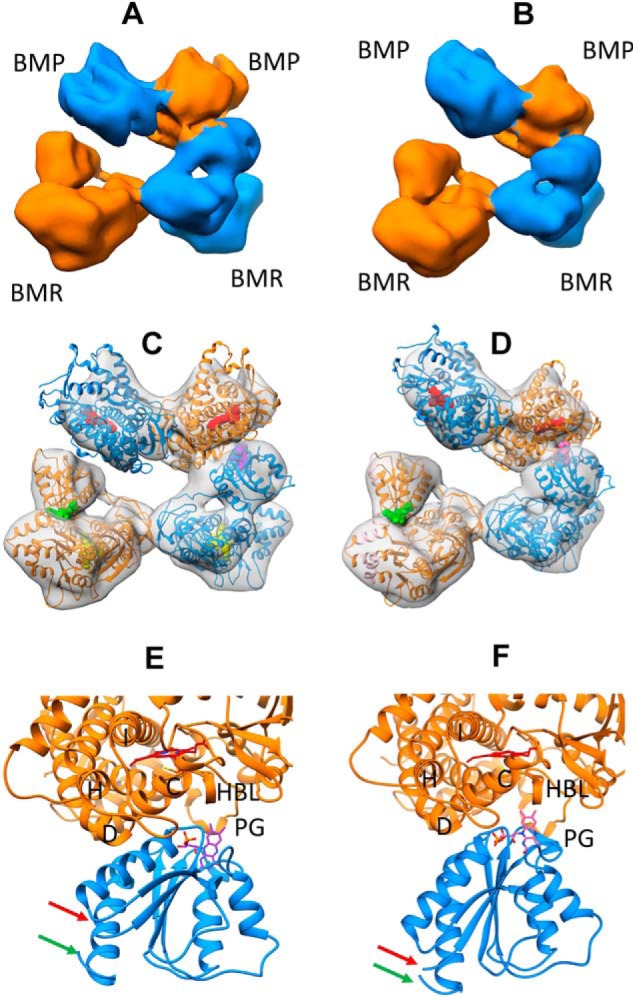
Architecture of full-length CYP102A1 homodimer in open states determined by cryo-EM. A, cryo-EM density map at 8.3 Å for full-length CYP102A1. The two monomers are colored in orange and blue, respectively. B, cryo-EM density map at 8.5 Å for full-length CYP102A1. The two monomers are colored in orange and blue, respectively. C, 3D model of full-length CYP102A1 fit to the 8.3 Å density map (open state I). The map is shown as a transparent surface, and the two monomer chains are colored in orange and blue ribbons, respectively. Cofactor heme and FAD are displayed as space-filled spheres in red and yellow, respectively. Cofactor FMN in closed conformation is displayed as a space-filled sphere in green, whereas FMN in open conformation is shown as a space-filled sphere in purple. D, 3D model of full-length CYP102A1 fit to the 8.5 Å density map (open state II). The color scheme is identical to that in C except that FMN in the open conformation is colored in pink. E, expanded view of ET complex in open state I between the heme domain and open FMN domain. Key structural features are labeled as helix C, D, H, and I, PG (Pro383–Gln387 peptide), and HBL (heme-binding loop). The red and green arrows point to the linker and hinge, respectively. F, expanded view of ET complex in open state II between the heme domain and open FMN domain. The color scheme is identical to that in E.
