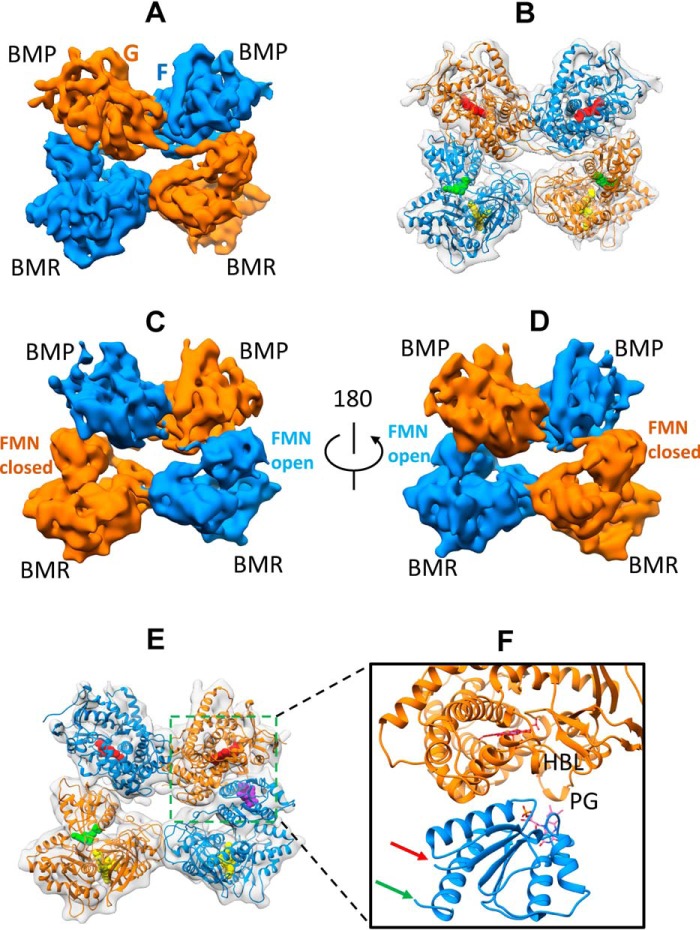
Figure 4.
Architecture of the Δ12 variant homodimer in closed and open states determined by Cryo-EM. A, cryo-EM density map at 6.7 Å for the Δ12 variant homodimer in the closed state. The two monomers are colored in orange and blue surface, respectively. B, 3D model of the Δ12 variant fit to the 6.7 Å density map. The color scheme is the same as in Fig. 2B. C, front side of the cryo-EM density map at 7.9 Å for the Δ12 variant homodimer in the open state. D, 180° view of the back side of the cryo-EM density map at 7.9 Å for the Δ12 variant homodimer in the open state (E). Shown is a 3D model of the Δ12 variant fit to the 7.9 Å density map. The color scheme is identical to that used in Fig. 3C. F, zoom view of the ET complex of the Δ12 variant in the open state. HBL and PG, heme-binding loop and Pro383–Gln387 peptide, respectively.

