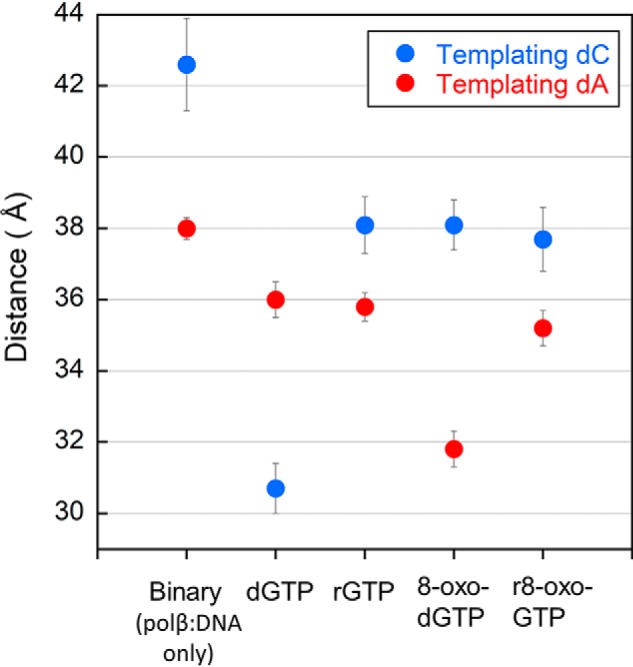
Figure 4.

Calculated interprobe distances from FRET efficiencies during steady-state FRET experiments. Efficiencies from triplicate measurements are plotted for the following complexes opposite either a templating cytosine (dark blue) or templating adenine (red): binary; ternary with dGTP, rGTP, or r8-oxo-GTP; with error bars (black) calculated using standard deviation of the mean. Distance values are reported in Fig. S3 and are as follows: 42.6 ± 1.3 Å (binary:dC), 38.0 ± 0.3 Å (binary:dA), 30.7 ± 0.7 Å (dGTP:dC), 36.0 ± 0.5 Å (dGTP:dA), 38.1 ± 0.8 Å (rGTP:dC), 35.8 ± 0.4 Å (rGTP:dA), 38.1 ± 0.7 Å (8-oxo-dGTP:dC), 31.8 ± 0.5 Å (8-oxo-dGTP:dA), 37.7 ± 0.9 Å (r8-oxo-GTP:dC), and 35.2 ± 0.5 Å (r8-oxo-GTP:dA).
