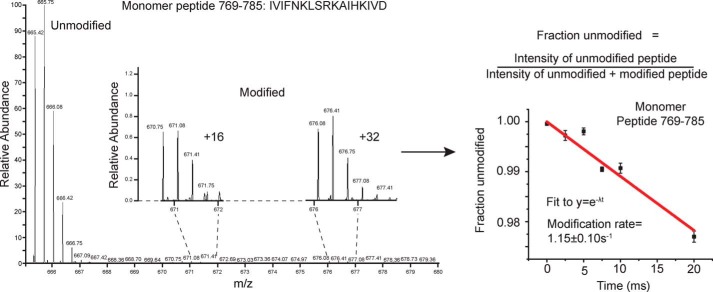
Figure 1.
X-ray exposed Hsp104 mass spectra and curve fitting. Unmodified and modified versions of the Hsp104 peptides were identified by ExMS-CL in each time point. The intensities of the singly-modified peptides were pooled, and the fraction unmodified was calculated for each time point. A pseudo–first-order decay curve extrapolated to zero was then fit to the data.

