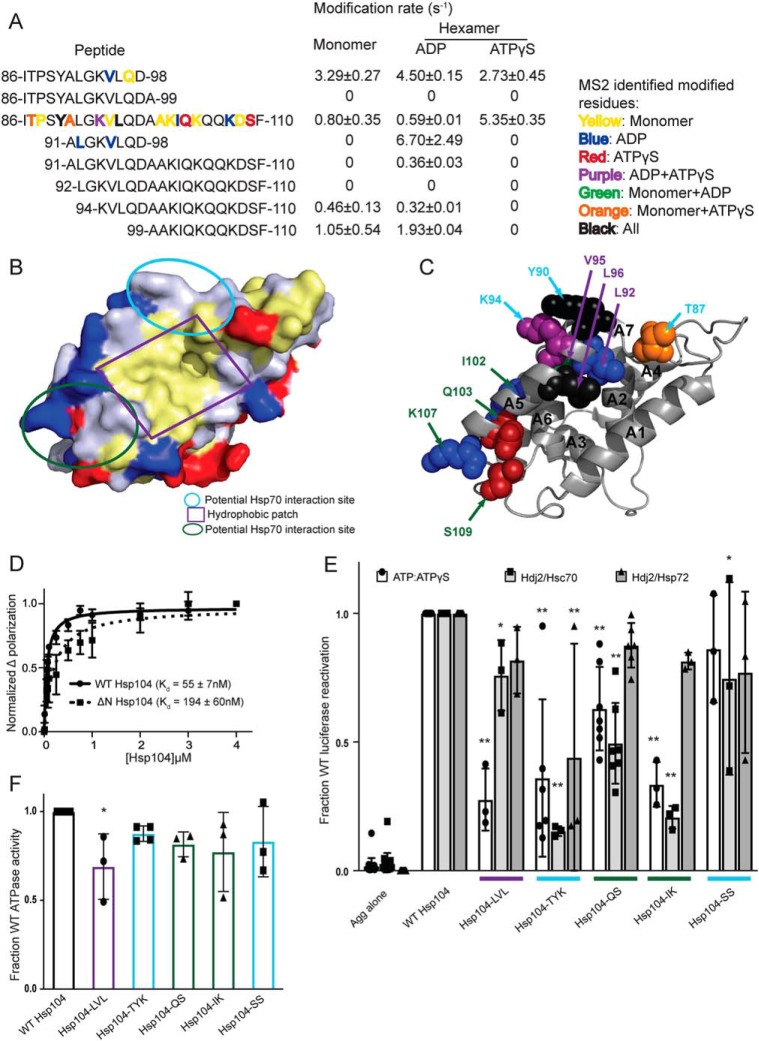
Figure 2.
Hsp104 NTD is involved in substrate and Hsp70 interactions. A, peptide sequences and modification rates for a region of the Hsp104 NTD that is highly modified. Residues shown in bold have been identified as modified by MS2 and are colored by the state in which they were found: yellow, monomer; blue, hexamer with ADP; red, hexamer with ATPγS; purple, both hexameric states; green, monomer and hexamer with ADP; orange, monomer and hexamer with ATPγS; black, modified in all states. B, surface rendering of Hsp104 NTD from the crystal structure of the S. cerevisiae Hsp104 NTD (PDB code 5u2u). Acidic residues are shown in red, basic residues in blue, and hydrophobic residues in yellow. Circled regions are important in the structurally-conserved ClpA (PDB code 1r6c) NTD for ClpS binding as follows: site A in green, site C in light blue, and the conserved hydrophobic patch for substrate binding in purple. C, Hsp104 NTD with residues identified by MS2 as modified in a hexameric state are shown as spheres and labeled when visible. Spheres were colored by the states in which they were found modified, as in A, and labeled with colors corresponding to the regions outlined in B. D, FITC-casein, 2 mm ATPγS, and either Hsp104 or Hsp104ΔN were incubated for 20 min at 25 °C. Fluorescence polarization was measured at increasing concentrations of Hsp104, and a single site Kd was calculated using a least-squares fit to the data. Each data point represents mean ± S.E. (n = 4–5). E, urea-denatured firefly luciferase aggregates were incubated with Hsp104 or an Hsp104 variant, Hsp104-LVL (L92A/V95A/L96A), Hsp104-TYK (T87A/Y90A/K94A), Hsp104-QS (Q103A/S109A), Hsp104-IK (I102A/K107A), or Hsp104-SS (S124A/S125A) for 90 min at 25 °C in the presence of either 5.1 mm ATP or ATP/ATPγS; 2.6 mm ATP, and 2.5 mm ATPγS, or Hdj2/Hsc70; 5.1 mm ATP, 1 μm Hdj2, and 1 μm Hsc70, or Hdj2/Hsp72; 5.1 mm ATP, 1 μm Hdj2, and 1 μm Hsp72. Reactivation of luciferase was then determined by measuring luminescence and converted to fraction WT activity for each condition. Data are displayed as scatterplot with bar representing mean ± S.D. (n = 3–7). One-way ANOVA with Dunnett's test was performed against Hsp104-WT with * denoting p < 0.05 and ** p < 0.01. Hsp104 variants are colored based on their location as shown in B. F, ATPase activity for Hsp104 and variants. Hsp104 variants are colored based on their location in the regions highlighted in B. Data are displayed as scatterplot with bar representing mean ± S.D. (n = 3–4). One-way ANOVA with Dunnett's test comparing the variants to Hsp104-WT were performed with * denoting p < 0.05.

