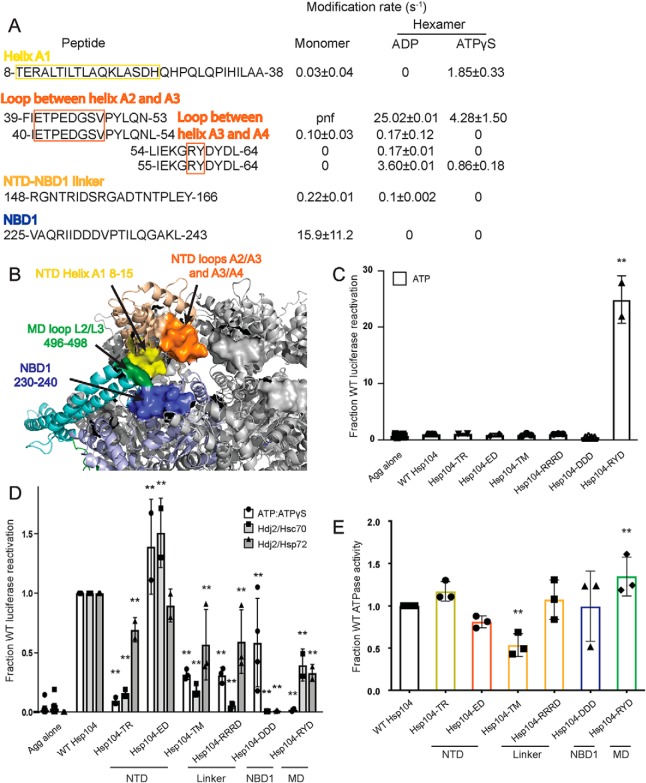
Figure 3.
NTD–NBD1–MD interface regulates Hsp104 disaggregase activity. A and B, based on the solvation data from XF, there may be regions of the Hsp104 NTD, NBD1, and MD that make contacts that are nucleotide-dependent. In the NTD, these regions are the beginning of helix A1 in the hexamer with ADP (residues 8–15 in yellow), the A2–A3 loop (residues 39–53 in orange), and NTD–NBD1 linker (not pictured) in the hexamer with ATPγS. Based on: (1) the XF data, (2) the three monomeric tClpB crystal structures (PDB code 1qvr), and (3) the hexameric cryo-EM reconstruction (PDB code 5vy9, shown in B), we suggest that these NTD regions may be making a stable interaction with NBD1 (specifically residues 230–240 in blue) and in the hexamer with ATPγS the MD in the loop between MD helices L2 and L3 in motif 2 (residues 496–498 in green). Shifts in these contacts in response to stimuli such as Hsp70 binding, substrate binding, or ATP hydrolysis could transmit signals through the hexamer and facilitate cooperativity. In the table with rate information, pnf denotes “peptide not found.” C and D, urea-denatured firefly luciferase aggregates were incubated with either WT or an Hsp104 variant, Hsp104-TR (T8A/R10A), Hsp104-ED (E44R/D45R), Hsp104-TM (T160M), Hsp104-RRRD (R148D/R152D/R156D), Hsp104-DDD (D231A/D232A/D233A), or Hsp104–RYD (R496A/Y497A/D498A) for 90 min at 25 °C in the presence of either 5.1 mm ATP (C) or ATP/ATPγS; 2.6 mm ATP and 2.5 mm ATPγS or Hdj2/Hsc70; 5.1 mm ATP, 1 μm Hdj2, and 1 μm Hsc70 or Hdj2/Hsp72; 5.1 mm ATP, 1 μm Hdj2, and 1 μm Hsp72 (D). Reactivation of luciferase was then determined by measuring luminescence and converted to fraction WT activity for each condition. Data are displayed as scatterplot with bar representing mean ± S.D. (n = 2–4). One-way ANOVA with Dunnett's test comparing the variants to Hsp104-WT were performed with ** denoting p < 0.01. E, ATPase activity for Hsp104-WT and variants. Hsp104 variants are colored based on their location as shown in A and B. Values represent mean ± S.D. (n = 3). One-way ANOVA with Dunnett's test comparing the variants to Hsp104-WT were performed with ** denoting p < 0.01.

