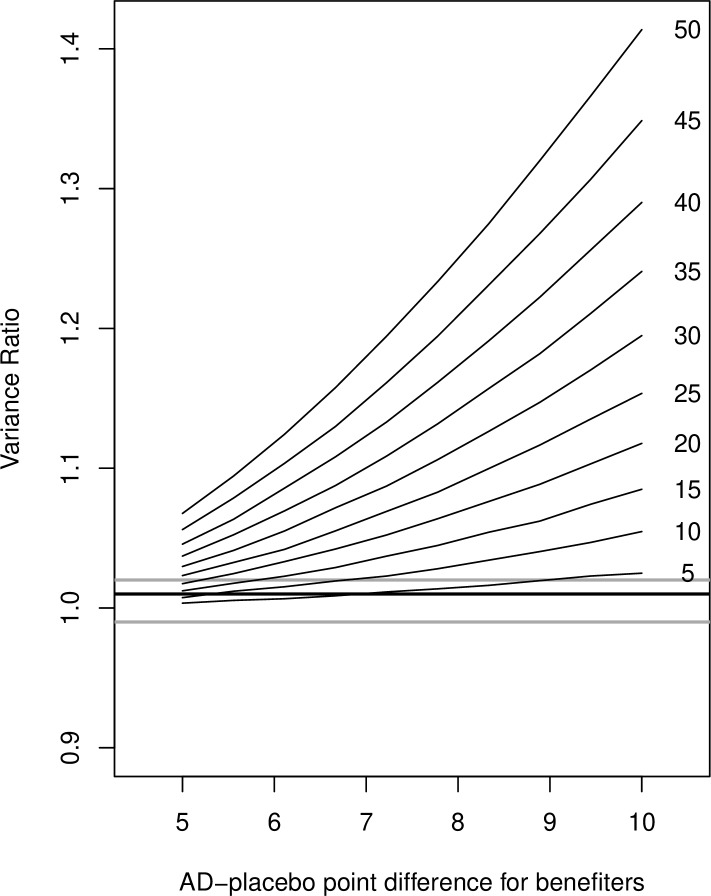
Figure 1.
Results from simulation analyses (hypothetical variance ratios) for different definitions of benefiters (x-axis) and different percentages of benefiters (individual lines with the percentages on the right side of the line). The horizontal thick line is the result from our meta-analysis (VR=1.01), the horizontal grey lines correspond with upper and lower limits of the CI of the meta-analysis (0.99–1.02). VR, variance ratio; AD, antidepressant.

