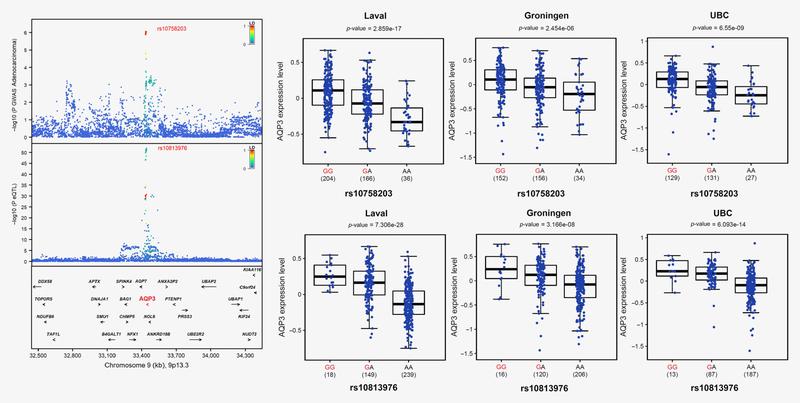
Figure 3.
A novel susceptibility locus for adenocarcinoma on 9p13.3 with AQP3 as the underlying gene. The upper left panel shows the genetic associations with adenocarcinoma in TRICL-ILCCO OncoArray. The bottom left panel shows the lung eQTL statistics for AQP3. The location of genes is illustrated at the bottom. The right panel shows boxplots of gene expression levels in the lung according to genotype groups for Laval, Groningen, and UBC samples. The y-axis shows the mRNA expression levels. The x-axis shows the three genotype groups for the SNP most strongly associated with lung cancer (upper right) and the SNP most strongly associated with mRNA expression of AQP3 (lower right) with the number of individuals in parenthesis. The risk allele in TRICL-ILCCO OncoArray is shown in red.

