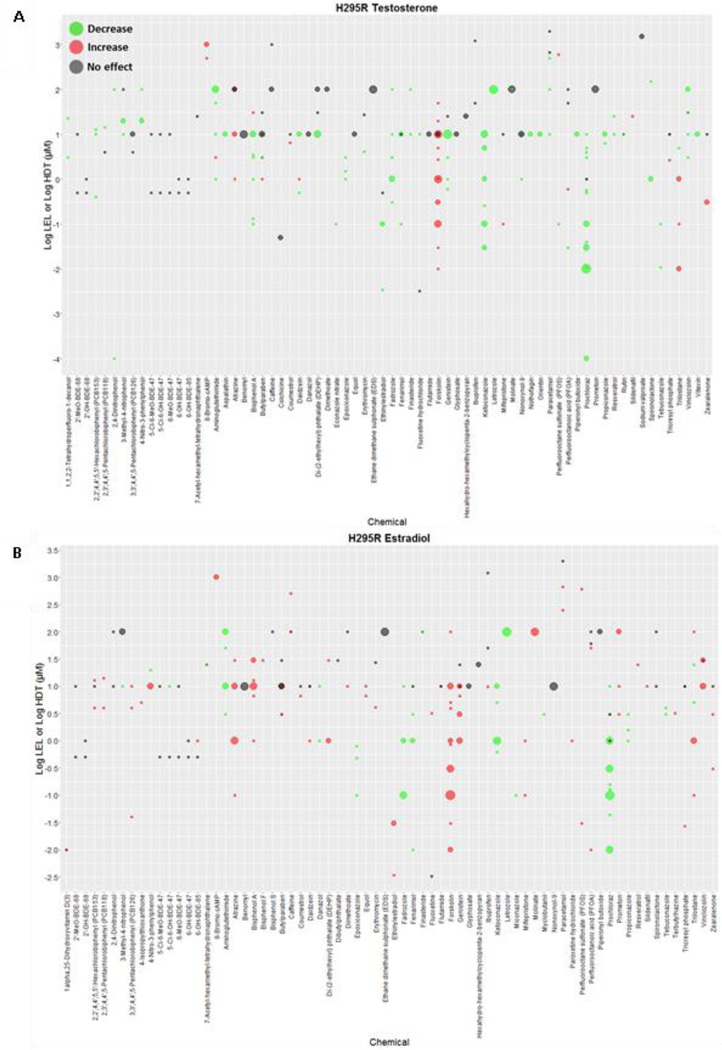
Figure 2. Results of the effect of 70 chemicals identified in H295R studies on T and E2 levels.
Chemicals are listed along the x-axis and the log10 transformed concentrations along the y-axis. Green and red dots represent LELs (or AC50s) of studies reporting decreases and increases, respectively, in T (Panel A) or E2 (Panel B). Gray dots indicate HCT for negative results. The size of the dots is proportional to the number of studies (range 1 – 7). Plot includes OECD H295R validation results and H295R literature studies of chemicals tested in one or more concentrations. Similar plots for chemical effects on A4 and E1 are provided in supplemental figures 1 and 2, respectively. (LEL = Lowest effect level; HCT = highest concentration tested)

