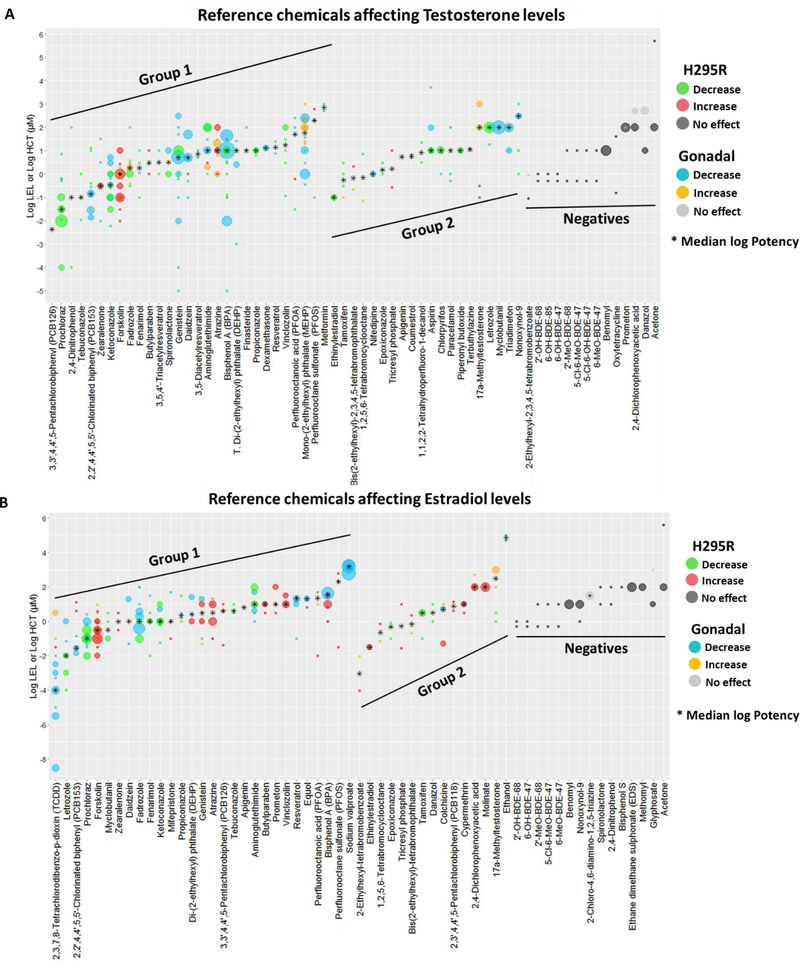
Figure 5. Potency values for candidate reference chemicals affecting T and E2 levels.
The log LELs (or log AC50s) are indicated for positive Group 1 and Group 2 candidate reference chemicals, and the HCT is indicated for candidate negative reference chemicals. A. Plot of candidate reference chemicals affecting T levels. A total of 359 positive and 42 negative studies are plotted. The log LEL and log AC50 are represented for 336 and 23 studies, respectively. Details on studies used for potency characterization is in Supplemental file 7. B. Candidate reference chemicals affecting E2 levels. A total of 322 positive and 45 negative studies are plotted. The log LEL and log AC50 are represented for 302 and 20 studies, respectively. Details on studies used for potency characterization is in Supplemental file 10. Only studies testing the effect of a chemical in at least two concentrations are plotted and included for calculation of median log potency values. Green and blue dots indicate, respectively, H295R and gonadal studies showing a decrease (inhibition) on the levels of hormones; red and yellow dots represent H295R and gonadal studies indicating an increase (induction) on hormone levels. Black asterisk indicates the median log potency value. Dark and light gray dots indicate HCTs for negative chemicals. The size of the dots is proportional to the number of studies. (LEL = Lowest effect level; HCT = highest concentration tested).

