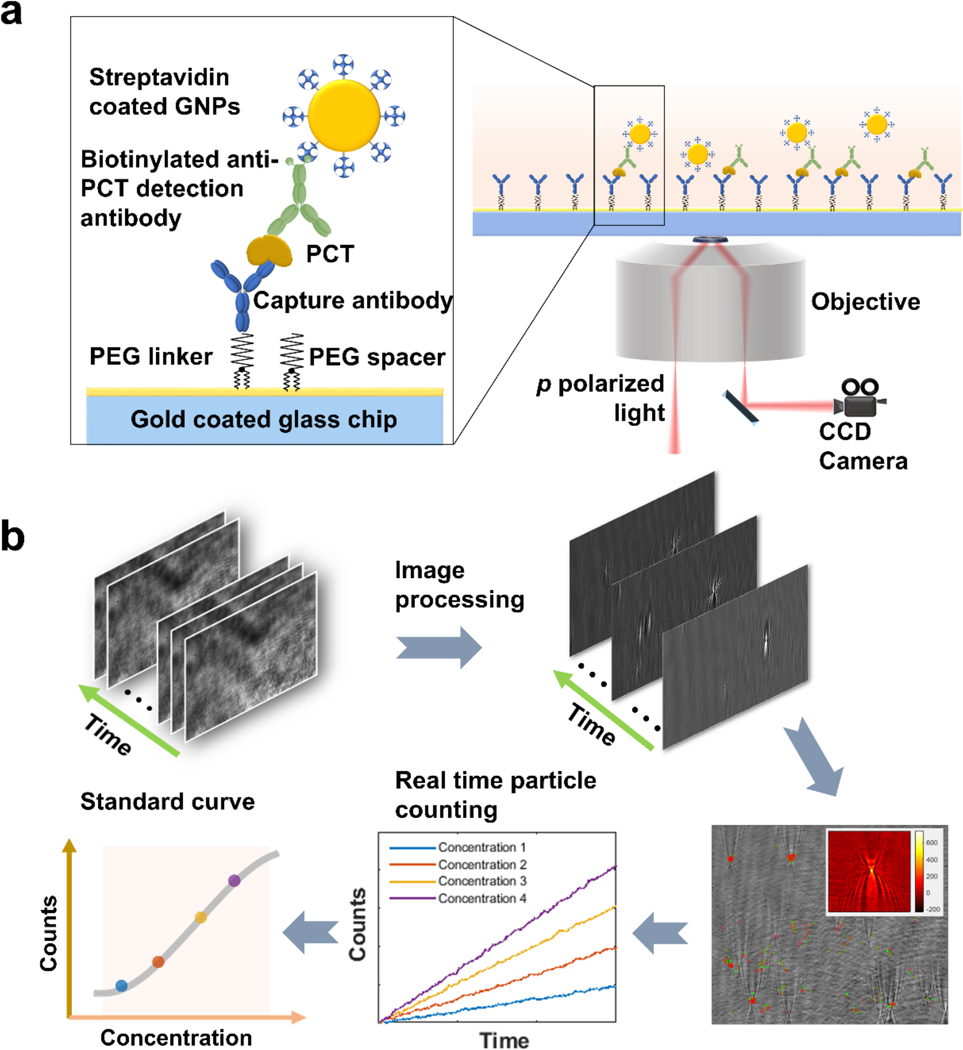
Figure 1. Schematic illustration of time-resolved digital immunoassay.
(a) Experimental setup. A SPR sensor chip (gold-coated glass slide) is functionalized with capture antibody via polyethylene glycol (PEG) linker. PCT in the sample solution binds to the capture antibody, which is detected by gold nanoparticles that bind to a detection antibody that binds to the PCT on the capture antibody. The binding processes are monitored with a plasmonic imaging system built on an inverted optical microscope with details described in the text. (b) Tracking individual binding and unbinding events of single GNPs with an imaging processing algorithm that removes background noise from the raw plasmonic images via differential imaging, tracks binding and unbinding of the gold nanoparticles to the sensor surface, determines the net count of bound gold nanoparticles vs. time, and generate a standard curve (binding events. Vs. PCT concentration). More detailed description is provided in Figure S2.

