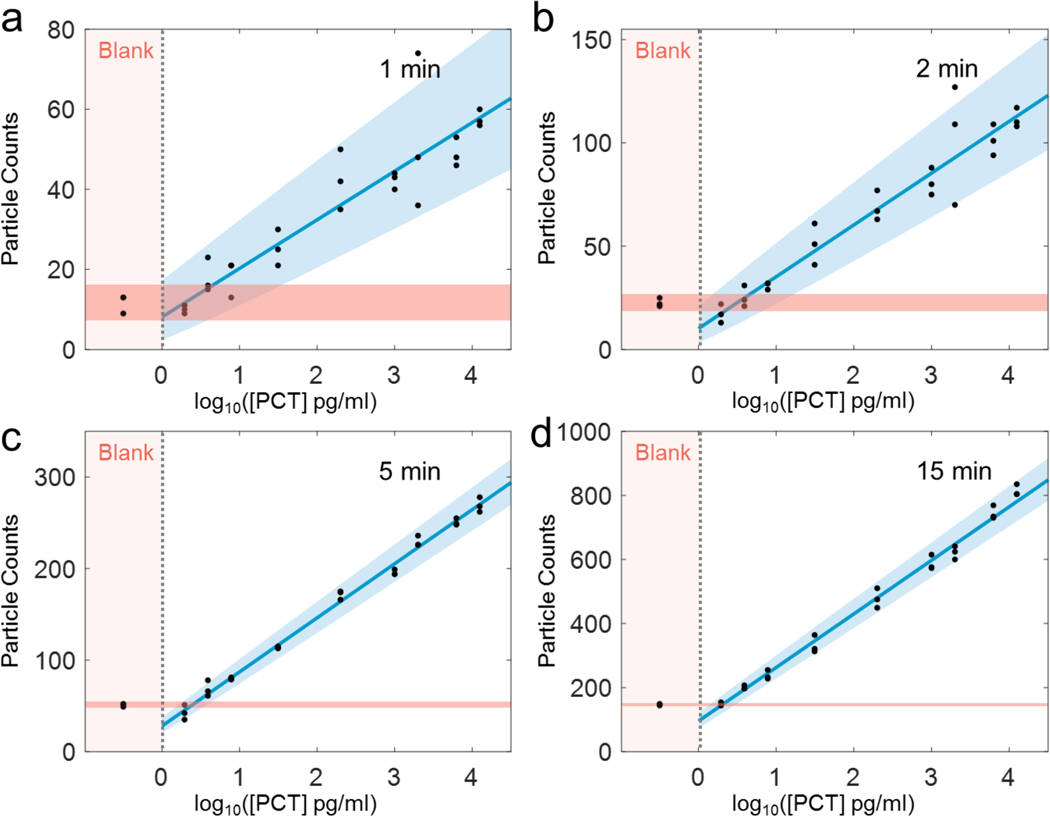
Figure 4. Particle counts vs. PCT concentration at different counting time intervals.
TD-immunoassay measurements of PCT at different concentrations and comparison with blank solutions for 1 (a), 2 (b), 5 (c), 15 (d) min of gold nanoparticle counting time intervals. The counts of measurement are proportional to logarithm of PCT concentration, where the solid blue line is linear fitting to the data, the light blue and light red regions indicate 95% prediction interval according to the statistic model (materials and methods, statistical analysis) and measurement data. Three replicates for each concentration was carried out.

