
Fig. 2.
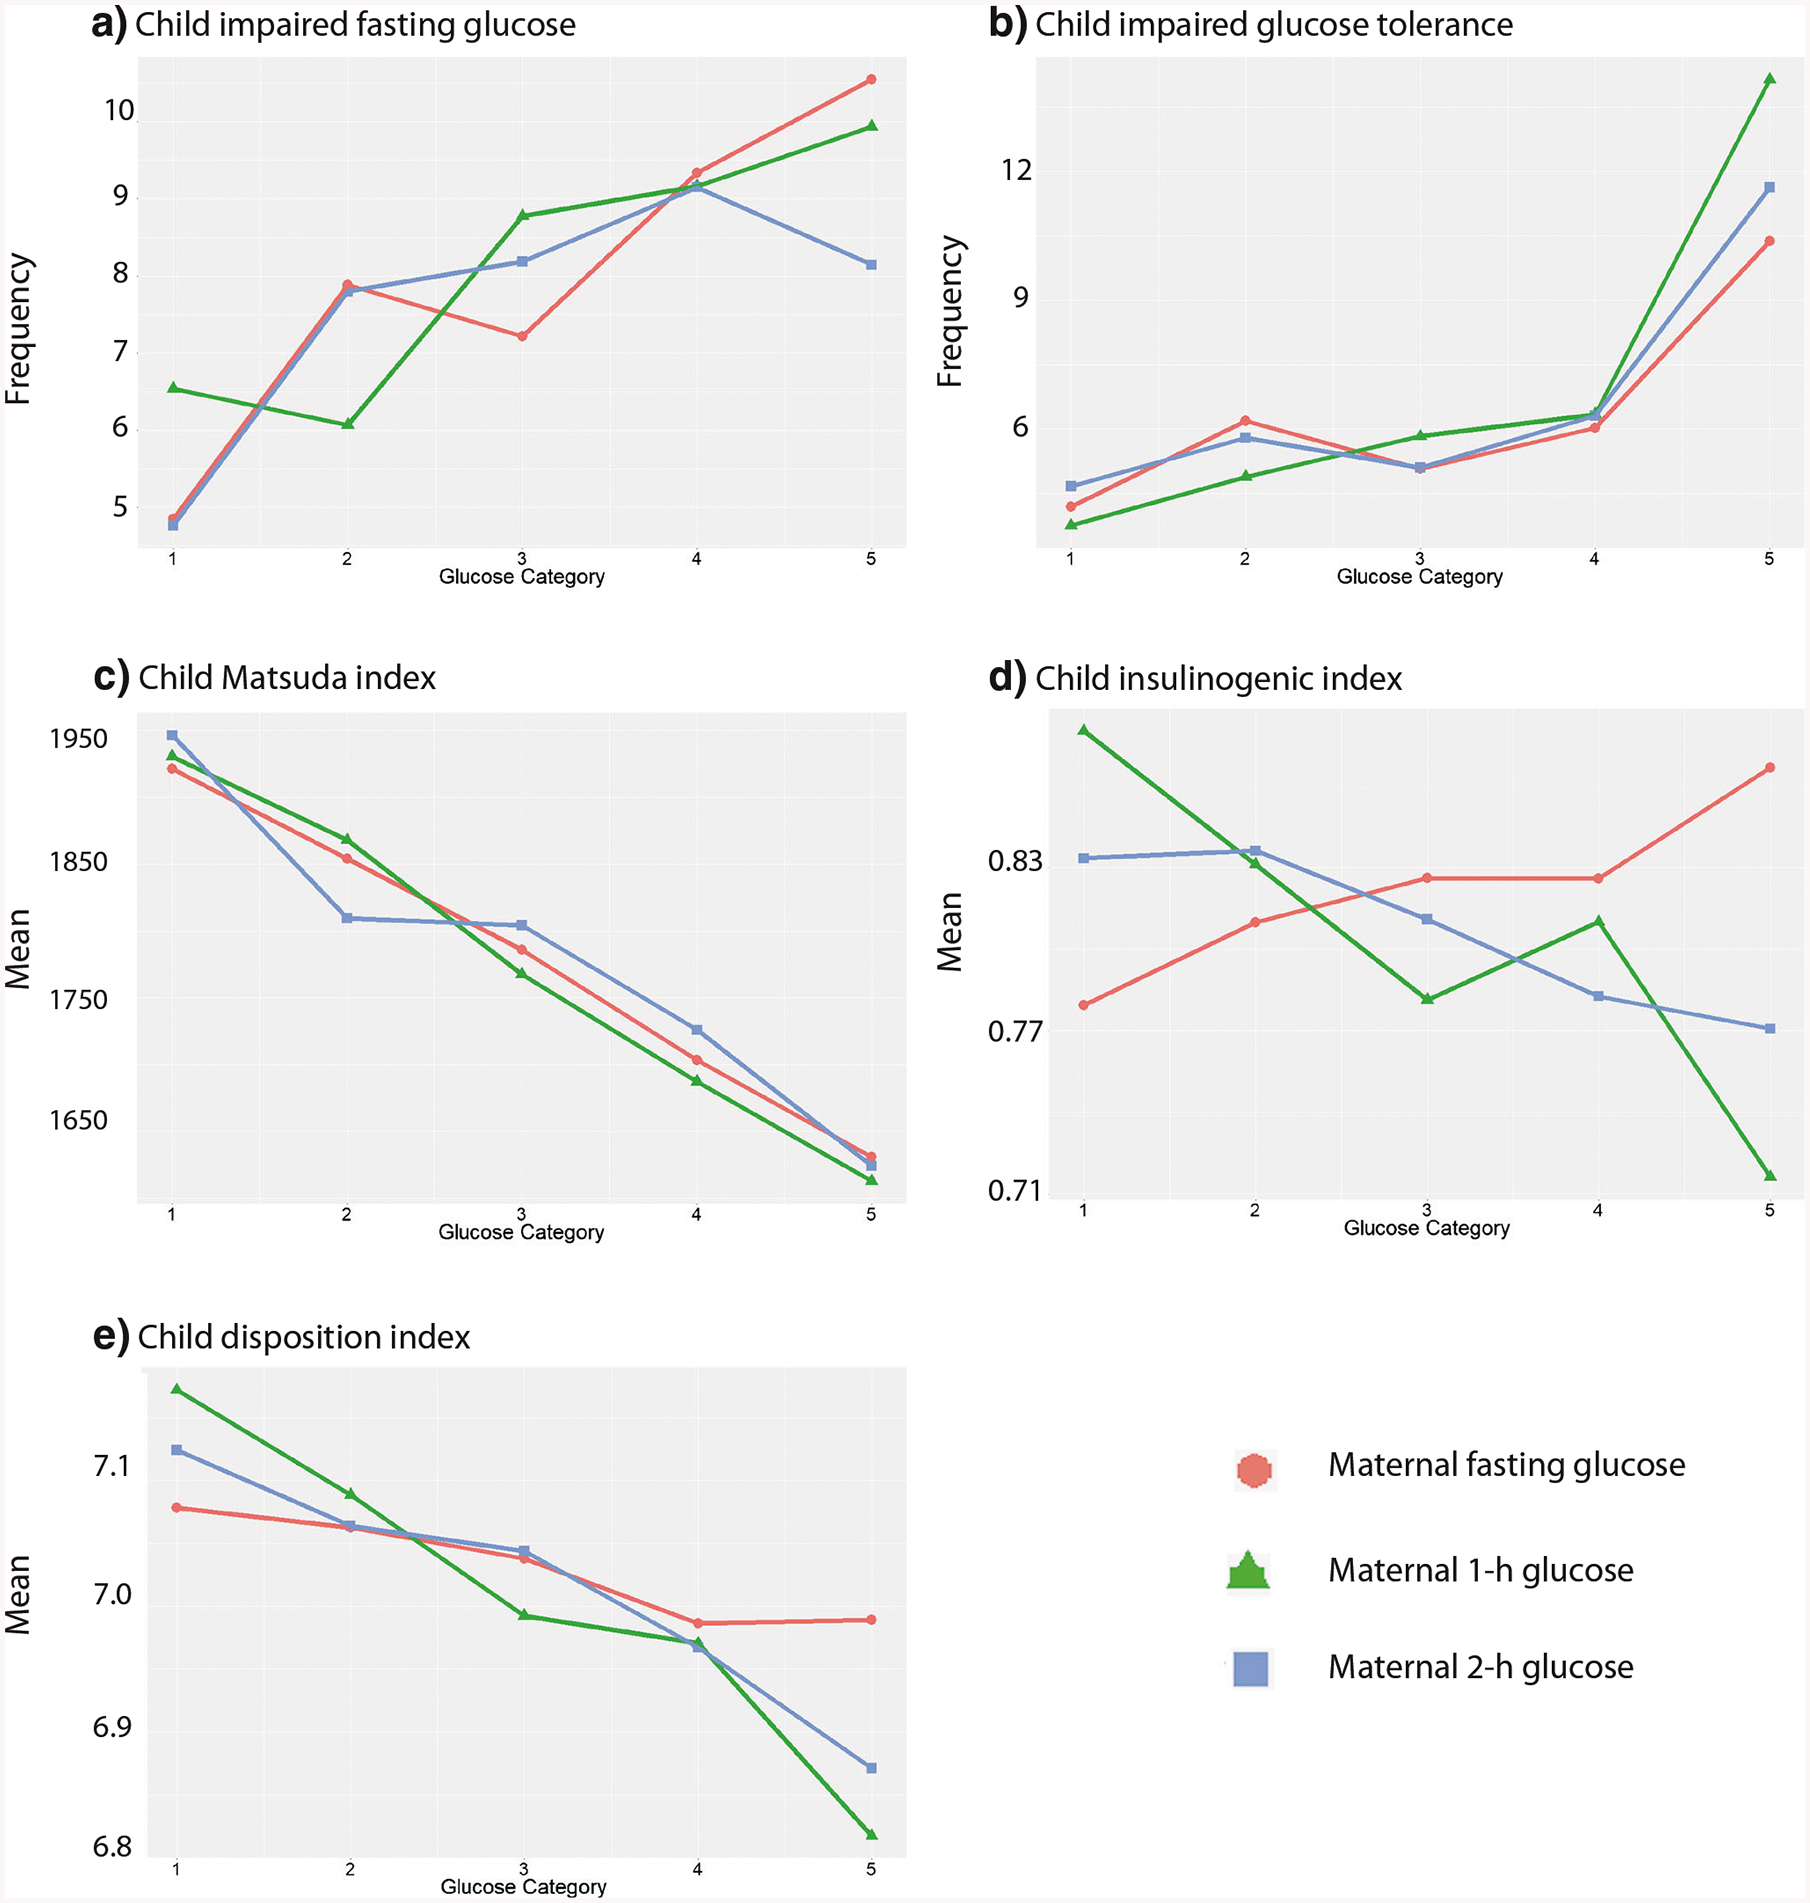
Child glucose outcomes across categories of maternal glucose levels. The frequency of childhood IFG (a) and IGT (b) and means of the Matsuda index (c), insulinogenic index (d), and disposition index (e) across categories of fasting, 1-h, and 2-h PG is shown. Glucose categories are defined as follows: fasting PG level—category 1, < 4.2 mmol/L; category 2, 4.2–4.4 mmol/L; category 3, 4.5–4.7 mmol/L; category 4, 4.8–5.0 mmol/L; and category 5, 5.1 mmol/L or more; 1-h PG level—category 1, 5.8 mmol/L or less; category 2, 5.9–7.3 mmol/L; category 3, 7.4–8.6 mmol/L; category 4, 8.7–9.9 mmol/L; and category 5, ≥ 10.0 mmol/L; and 2-h PG level—category 1, ≤ 5.0 mmol/L; category 2, 5.1–6.0 mmol/L; category 3, 6.1–6.9 mmol/L; category 4, 7.0–8.4 mmol/L; and category 5, ≥8.5 mmol/L (from: Scholtens et al. Diabetes Care. 2019;42 [3]:381–92. American Diabetes Association [Diabetes Care, American Diabetes Association, 2019]. Copyright and all rights reserved. Material from this publication has been used with permission of American Diabetes Association) [34•]