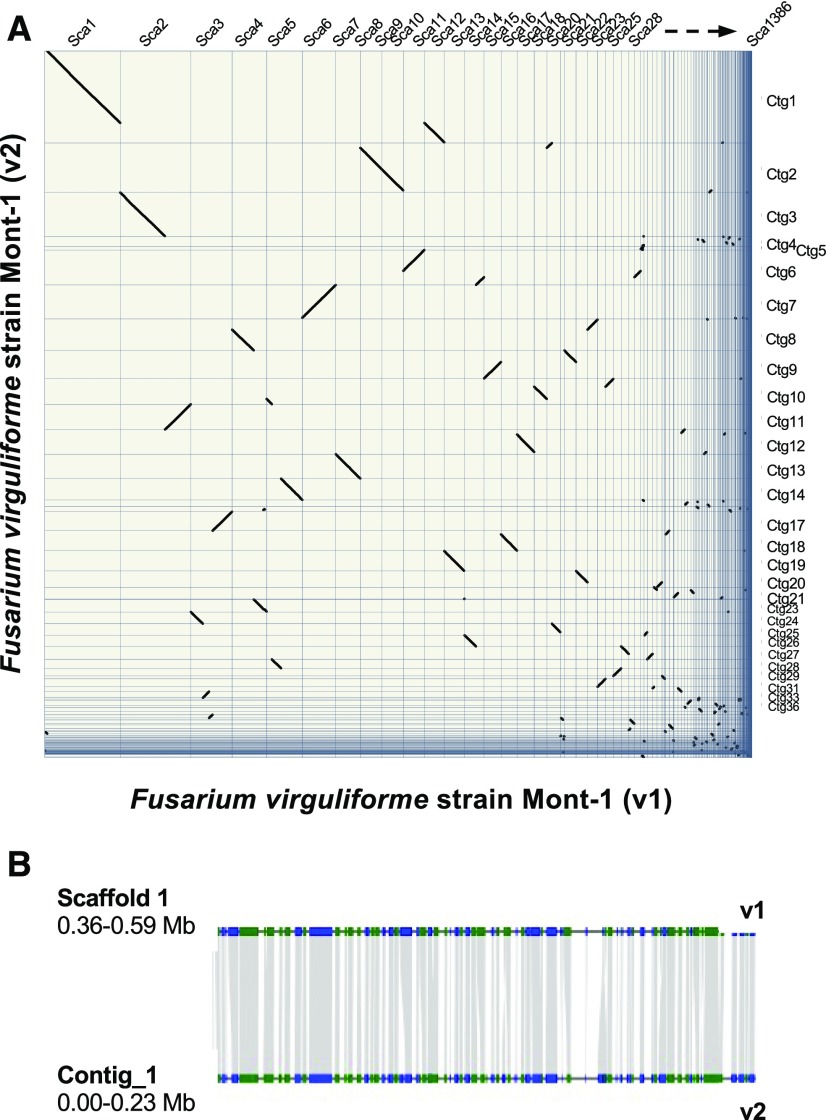
Figure 1.
Syntenic Regions between Genome Versions of Fusarium virguliforme.
(A) Plot of syntenic regions retained between genome version 1 (v1) and genome version 2 (v2). Diagonal lines, including differences in lengths, illustrate distances of overlap between F. virguliforme v1 and v2 genome versions, and the syntenic regions between the scaffolds (Sca) and contigs (Ctg) in each.
(B) Micro-collinearity between scaffold 1 of genome v1 and contig 1 of genome v2 connected by shaded gray areas. Regions containing genes are highlighted in green or blue, for forward or reverse orientation, respectively.

