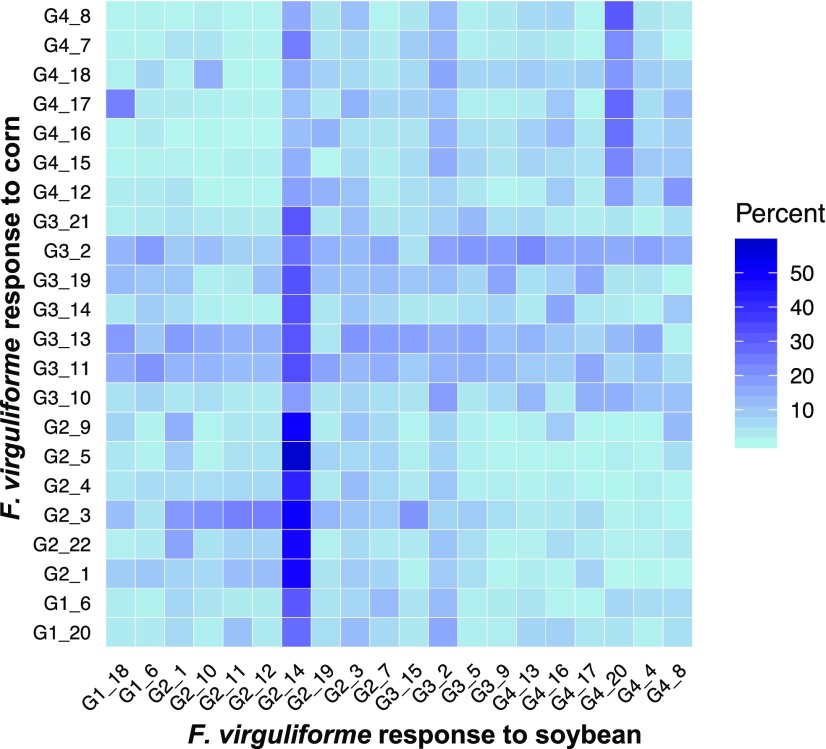
Figure 5.
Symptomatic and Asymptomatic Hosts Reveal Transcriptomic Plasticity during F. virguliforme Colonization.
The percent of overlapping genes from the weighted gene correlation network analysis modules was calculated as the ratio of the number of shared genes between F. virguliforme expression on each host divided by the total number of genes within the module that contained the fewest number of genes. Modules are annotated with grouping assignments as shown in Figure 4. The increasing shade of blue represents increasing percent module overlap of the gene count shared between the two modules.

