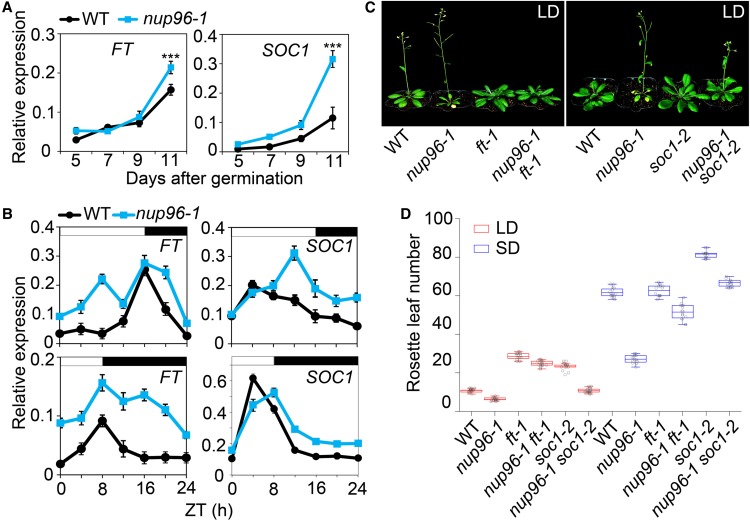
Figure 3.
Nup96 Regulates Flowering through Modulating the Expression of Floral Integrator Genes.
(A) qPCR analysis of FT and SOC1 expression in the wild type (WT) and nup96-1 mutants grown in long days for the indicated periods after germination. Values are means ± sd (n = 3 biological repeats). ***, P < 0.001.
(B) Diurnal expression of FT and SOC1 in wild-type and nup96-1 seedlings grown in long-day and short-day conditions for 9 d. Values are means ± sd (n = 3 biological repeats). White bars indicate day, and black bars represent night. WT, wild type.
(C) Flowering phenotypes of the indicated genotypes in long days. WT, wild type.
(D) Rosette leaf numbers at the time of flowering for the genotypes shown in (C); n > 20. Box plots are used to display the distributions of data points (presented as circles). The lines in the box (from top to bottom) indicate the maximum, third quartile, mean, first quartile, and minimum. WT, wild type.

