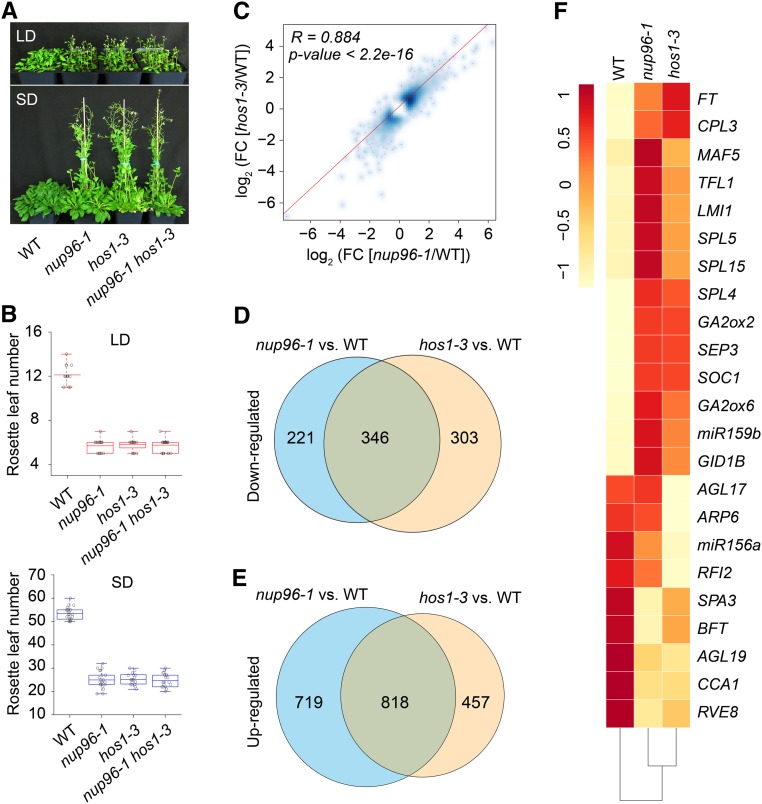
Figure 6.
Nup96 and HOS1 Mutations Cause Similar Transcriptomic Changes in Plants.
(A) Flowering phenotypes of the wild type (WT), nup96-1 and hos1-3 single mutants, and nup96-1 hos1-3 double mutants grown in long days (LD) and short days (SD).
(B) Rosette leaf numbers at the time of flowering for the genotypes shown in (A); n > 20. Box plots are used to display the distributions of data points (presented as circles). The lines in the box (from top to bottom) indicate the maximum, third quartile, mean, first quartile, and minimum. Red boxes and blue boxes present the data in long days and short days, respectively. WT, wild type.
(C) Scatterplot showing the expression correlation of differentially expressed genes in nup96-1 and hos1-3 mutants compared with the WT. Differentially expressed genes from RNA-seq data are defined as those with a fold change (FC; mutant/wild type) > 1.5 or < 0.67 (Fisher’s exact test, P < 0.01 and FDR < 0.01; Supplemental Data Set 2). The red line is the linear regression. R, Pearson correlation coefficient.
(D) and (E) Venn diagrams depicting the overlaps between the downregulated genes (D) and the upregulated genes (E) in nup96-1 and hos1-3 mutants. WT, wild type.
(F) Heatmap presenting the misregulated flowering time genes in nup96-1 or hos1-3 mutants compared with WT.

